
1. Objective and Conclusion
Objective: To analyse and compare the lipid states between raw duck egg yolk and salted duck egg yolk.
Preliminary Conclusion:
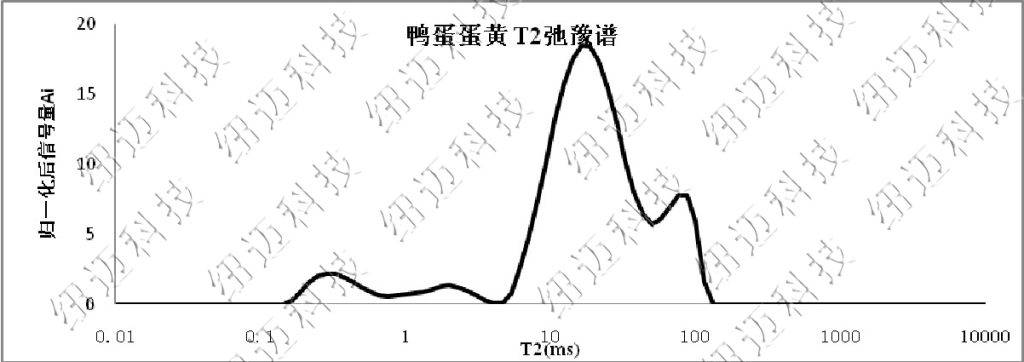
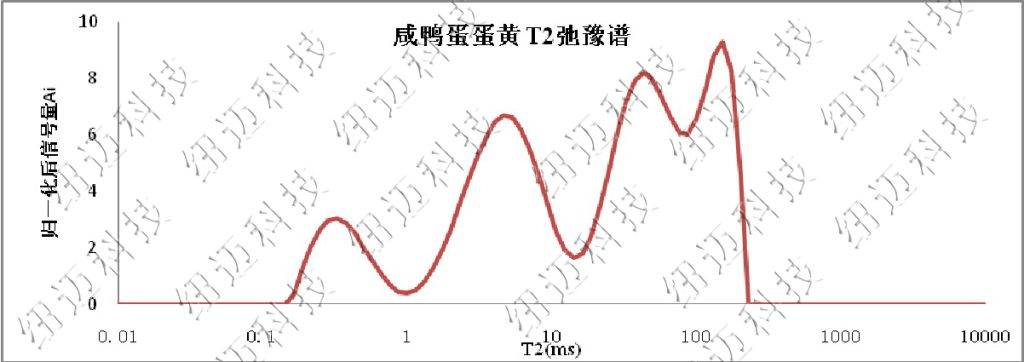
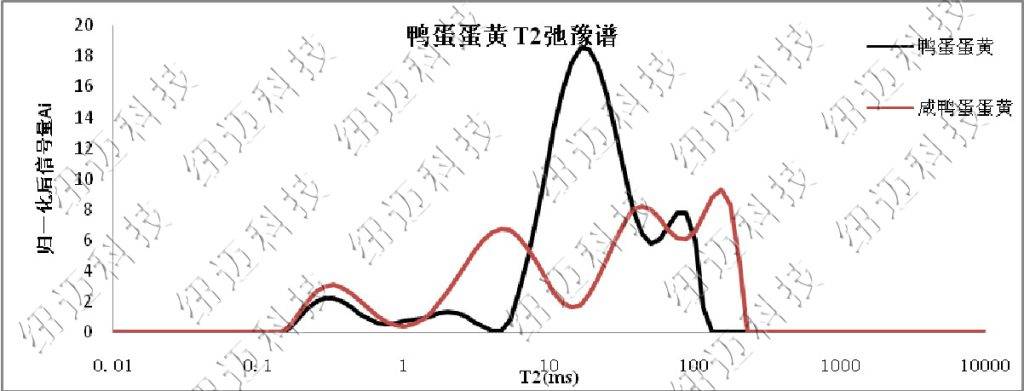
NMR T2 spectrum analysis clearly reveals the differences in lipid states between salted and regular duck egg yolks.
Further whole-egg MRI scanning demonstrates the lipid distribution within the salted duck egg yolk. Thanks to the non-destructive and rapid nature of NMR, imaging was conducted without any pre-treatment of the samples.
2.1 Materials
Fresh and salted duck eggs, purchased locally.
2.2 Instrumentation
Niumag MesoMR23-060H-I with a resonance frequency of 23.309 MHz and a coil diameter of 60 mm.
2.3 Sample Preparation
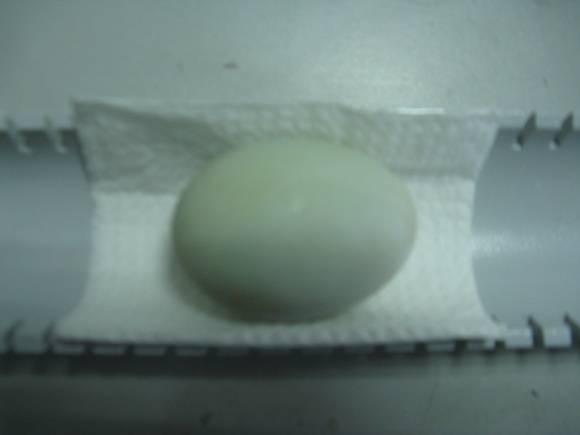
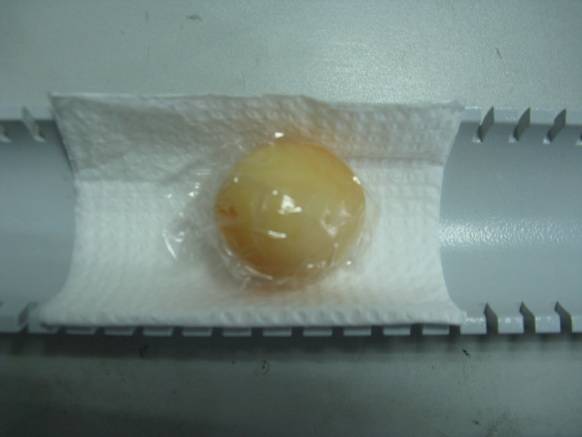
Both egg types were boiled in water for 6 minutes and scanned immediately using MRI without further processing. Shell and egg white were then removed, and the remaining yolk was used for T2 signal acquisition.
2.4 Experimental Method
CPMG Measurement: T2 signal acquisition for egg yolks was carried out using the CPMG sequence. Each sample was scanned in triplicate for accuracy.
MSE Imaging: Proton density images, T1-weighted, and T2-weighted images of both egg types were acquired using the MSE sequence. All images were saved in BMP format after adjusting sequence parameters accordingly.
3. Analysis and Results
T2 relaxation time reflects the micro-environment of hydrogen protons in the sample, influenced by binding forces and molecular mobility. Shorter T2 indicates stronger binding and lower mobility (peaks appear left in the spectrum), while longer T2 indicates weaker binding and higher mobility (peaks appear right).
3.2 MRI Imaging
Both yolk types were analysed using MRI. Thanks to the non-invasive nature of NMR, the imaging was performed directly on intact duck eggs with a slice thickness of 4.9 mm.
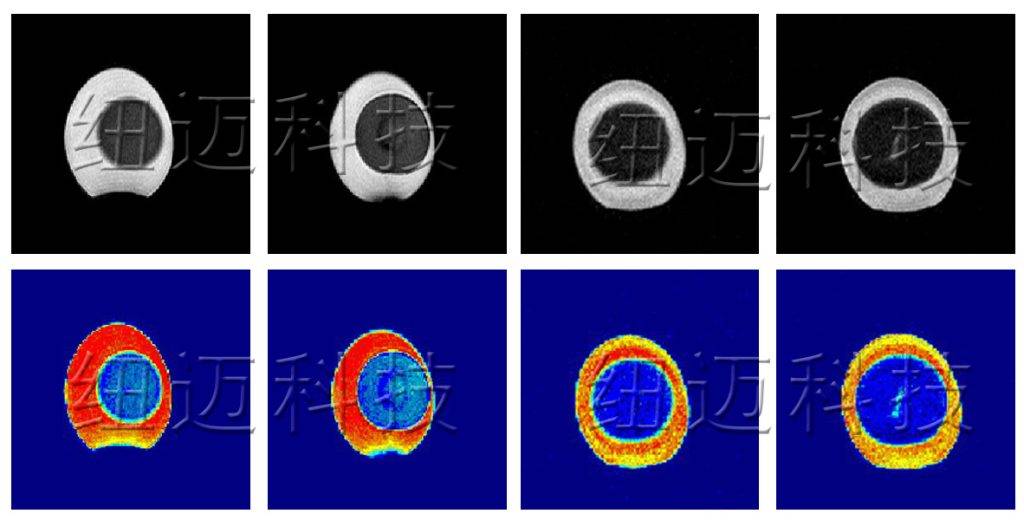
Coronal Plane Imaging
Salted Egg Yolk Fresh Egg Yolk
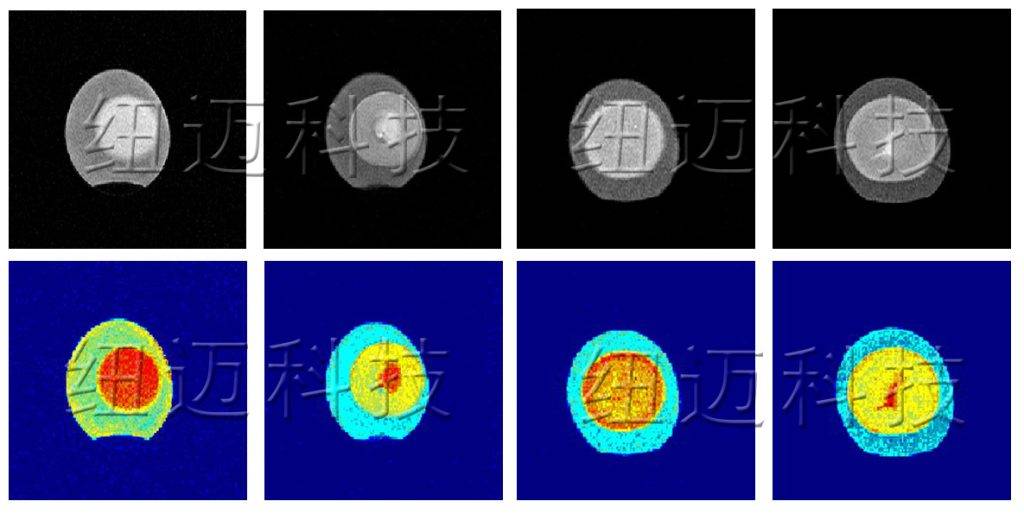
In T1-weighted imaging, long relaxation signals are suppressed, making shorter T2 signals appear brighter (or redder in pseudocolor images). This may indicate that some proteins in the salted yolk are precipitated by salting, leading to shorter relaxation times of bound water—displayed as a bright elliptical area in the image.
In T2-weighted images, short T2 signals are suppressed, so longer relaxation times appear brighter. In salted yolks, oil droplets tend to coalesce into larger ones, increasing relaxation time. As a result, salted yolk appears brighter than regular yolk overall, and the oil aggregation is clearly visible in the pseudocolor images.
 Scan QR Code
 Scan QR Code
Phone: 400-060-3233
After-sales: 400-060-3233


Back to Top