
Krstulovic-Dabic (KD) hydration kinetic model is commonly used to study the hydration mechanism of cement-based materials. Isothermal calorimetry is a widely used method for studying the hydration kinetics of cement-based materials, and the data obtained can effectively describe the hydration process. In this study, low-field nuclear magnetic resonance (NMR) was used to monitor the hydration process of cement-based materials, and after data processing, the results show that the KD model is also applicable to low-field NMR.
Because low-field NMR can continuously and non-destructively measure cement-based materials, it has a great potential compared to isothermal calorimetry in describing the hydration behavior of cement-based materials.
The invention of cement has surpassed 100 years, but its specific hydration mechanism is still not fully understood. This is because cement is composed of multiple components, each mineral has different hydration behaviors and interacts with each other, making the hydration process of cement especially complex. Generally, the hydration process is fundamental to cement-based materials, so understanding the hydration mechanism of cement-based materials is crucial for research on their microstructure and development process.
Low-field NMR technology is a fast, non-destructive, green, high-precision technique that can continuously monitor the hydration process of cement-based materials.
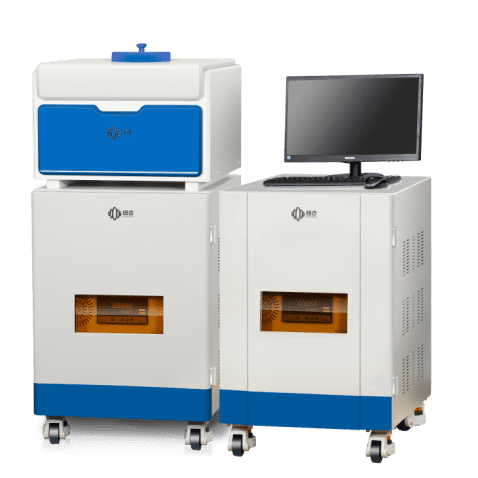
This study uses the low-field NMR equipment provided by Suzhou Niumai Analytical Instrument Co., Ltd. to test the hydration process. The equipment model is: NMRC12-010-T, configured with Portland cement and C3S samples for further study of the hydration process of different cement-based materials.
Since low-field NMR is a continuous monitoring method that uses water molecules as probes, the hydration rate of the entire hydration stage can be characterized by changes in the water signal. For comparison, the initial signal intensity of different samples is defined as 100%, to observe the differences in the hydration process.
Figure 1 shows the low-field NMR signals during the hydration process of different samples, PC-0.3-NMR and PC-0.5-NMR, over three days. The hydration process of cement can also be roughly divided into three stages according to the rate of change of signal intensity. During the first few hours of hydration, the hydration products are distributed on the unhydrated surface of the cement, making the overall hydration process slow, especially for PC-0.5-NMR. Then, the coating breaks, leading to the rapid reaction stage, and finally, the hydration rate gradually slows down and stabilizes.
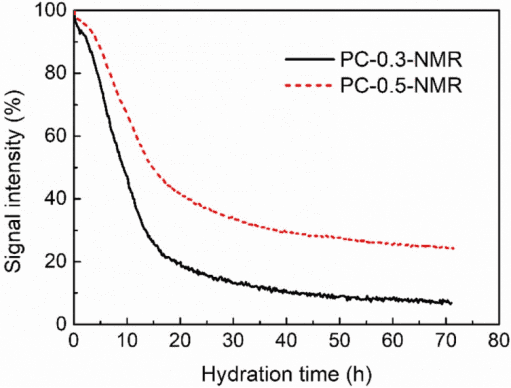
Figure 1 Hydration Process Low-Field NMR Signals of Different Cement Samples
Figure 1 shows the clear difference in the hydration processes of the two samples, PC-0.3-NMR and PC-0.5-NMR. The cement with a lower water-to-cement ratio (PC-0.3-NMR) exhibits a faster hydration rate in the early stages of hydration. The signal intensity of PC-0.3-NMR decreased by more than 90% within 72 hours of hydration, significantly higher than that of PC-0.5-NMR.
By processing the low-field NMR signals of the hydration process of different cement samples, specific characterization results for the degree of hydration of the samples can be obtained, as shown in Figure 2. The hydration of PC-0.5-NMR can still be divided into three stages. Compared to PC-0.3-NMR, PC-0.5-NMR shows an initial slow hydration rate that later increases.
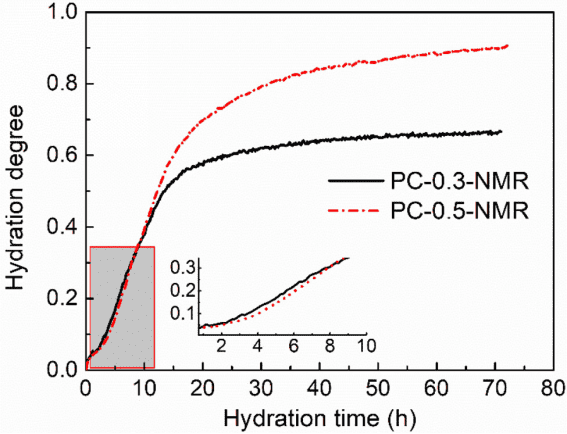
Figure 2 Hydration Degree Results from Low-Field NMR for Different Cement Samples
The low-field NMR results in Figure 2 are similar to the results measured by isothermal calorimetry, indicating that both methods exhibit a high degree of consistency in characterizing the hydration kinetics of cement. Therefore, it is feasible to establish a KD hydration kinetic model for cement-based materials using low-field NMR under theoretical premises.
By calculation, the kinetic curves of different hydration processes (NG, I, D) can be fitted, taking the PC-0.5-NMR sample as an example. The linear fitting results for the NG, I, and D processes are shown in Figure 3, with relatively small linear fitting errors. The kinetic parameters calculated by further formulas are: n = 2.2071, K’1 = 0.0609, K’2 = 0.01121, K’3 = 0.00183.
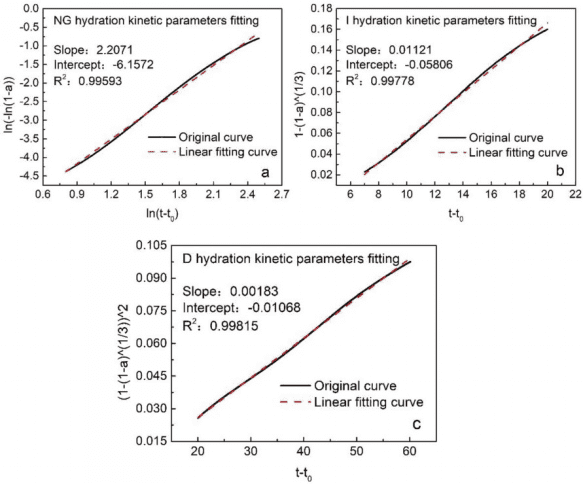
Figure 3 Linear Fitting Results for Different Hydration Processes (NG, I, D) of Portland Cement
Figure 4 shows the results of segmental simulation of the NG-I-D process of Portland cement using low-field NMR. The low-field NMR results also show that the hydration mechanism of PC changes from the NG process to I, and then to D. When the hydration degree is between 0 and 0.184, the hydration is mainly in the NG stage. When the hydration degree is between 0.184 and 0.269, the hydration process is mainly in the I stage. After 0.269, most of the hydration process is in the D stage.
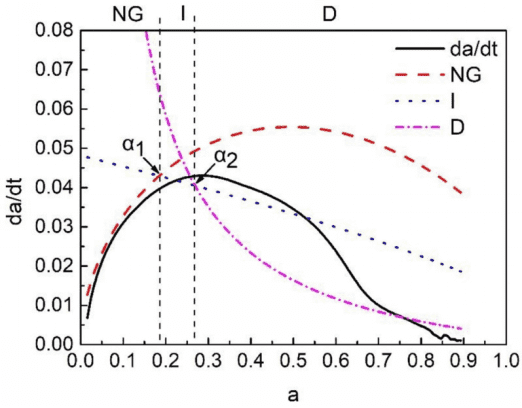
Figure 4 Segmented Simulation Results of the NG-I-D Process of Portland Cement
Similarly, for C3S, this study also uses low-field NMR to study its hydration kinetic model. Figure 5 shows the water signal amplitude and hydration degree results for C3S hydration over 6 days. Both results show that C3S has a faster hydration rate during the first ten hours of hydration. During this phase, the signal amplitude and hydration degree evolve faster, and then the hydration rate slows down. More importantly, after 6 days of hydration, the hydration degree of C3S was about 0.46, which is higher than the result from isothermal calorimetry (hydration degree of 0.27 after 6 days).
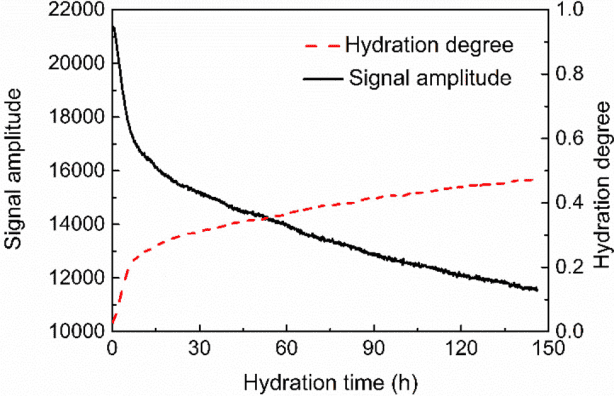
Figure 5 Signal Amplitude and Hydration Degree Results for C3S Hydration after 6 Days
This confirms that low-field NMR, using water as a probe, gives a higher hydration degree compared to isothermal calorimetry. It is worth noting that C3S takes a longer time to hydrate than Portland cement. Although both exhibit faster reaction rates in the initial stages of hydration, after 2-3 days of hydration, the reaction rate of Portland cement tends to stabilize.
By calculation, the kinetic curves for different hydration processes (NG, I, D) of C3S can be fitted, with the fitting results shown in Figure 6. The derived kinetic parameters for the NG, I, and D hydration processes are: n = 2.1812, K’1 = 0.0588, K’2 = 0.0161, K’3 = 0.0027.
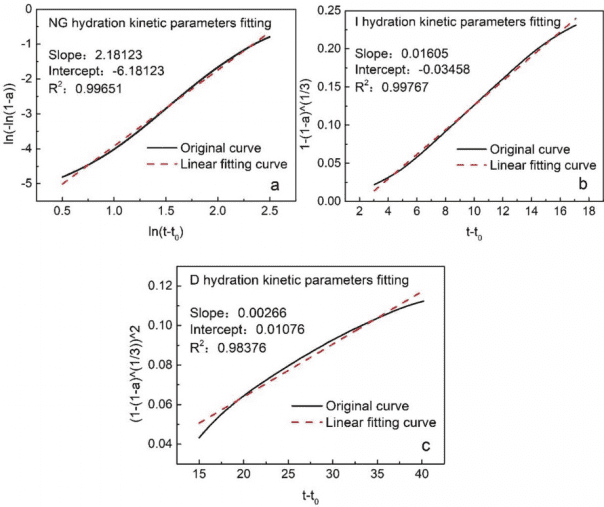
Figure 6 Linear Fitting Results for Different Hydration Processes (NG, I, D) of C3S
Figure 7 shows the segmented simulation results for the NG-I-D hydration stages of C3S using low-field NMR. As shown in Figure 7, the three hydration kinetic curves for NG, I, and D intersect at one point.
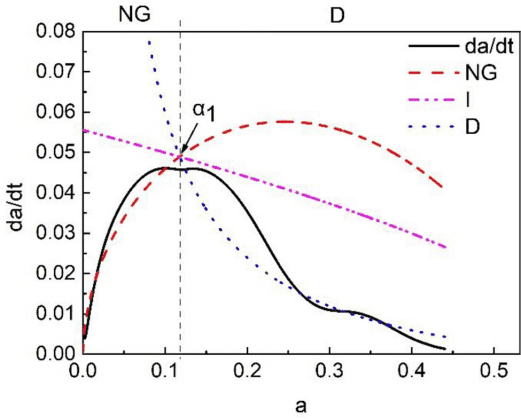
Figure 7 Segmented Simulation Results for C3S NG-I-D Process
Therefore, the hydration reaction of C3S is initially dominated by the NG process and then transitions to the D process, without going through the I process. When the hydration degree is between 0 and 0.127, the hydration of C3S is mainly in the NG stage. After the hydration degree reaches 0.127, the hydration reaction mainly occurs in the D stage.
This study used low-field NMR technology, based on the KD model, to investigate the hydration kinetics of Portland cement and C3S. The results show that the KD hydration kinetic model established by low-field NMR can serve as a reliable method for studying the hydration mechanism of cement-based materials. The conclusions are as follows:
[1] Anming She, Kun Ma, et al. Hydration kinetics of cementitious materials based on low-field NMR and isothermal calorimetry [J], Fullerenes, Nanotubes and Carbon Nanostructures 2022, 30:6, 607-618.

 Scan QR Code
 Scan QR Code
Phone: 400-060-3233
After-sales: 400-060-3233


Back to Top