

This featured article, published in 2022 in the SCI Q1 journal International Journal of Rock Mechanics and Mining Sciences, comes from the research team of Professor Zhijun Wu and Associate Researcher Lei Weng at Wuhan University. It explores the real-time characterisation of grout infiltration in fractured sandstone using low-field nuclear magnetic resonance (LF-NMR).
At the core of the study lies a real-time online LF-NMR rock seepage analysis system, which quantitatively tracks how grouting characteristics evolve under varying confining pressures, temperatures, and injection flow rates. The findings offer valuable insights for grouting reinforcement in deep, weak, fractured rock masses.
Grouting is a widely adopted technique in underground engineering for stabilising fractured rock masses and enhancing surrounding rock strength, known for its practicality and cost-effectiveness. However, due to the concealed nature of grouting operations and the anisotropy of rock formations, understanding grout migration and diffusion within fractures remains challenging. This makes it difficult to assess reinforcement effectiveness. Environmental factors like temperature and confining pressure further complicate fluid flow behavior. Existing studies lack real-time, high-resolution tracking of grout distribution during injection and often overlook the influence of external conditions.
This research leverages a real-time LF-NMR system to evaluate grout infiltration. It first examines how temperature affects the hydration and viscosity of ultrafine cement slurry, then conducts controlled experiments simulating subsurface conditions with varying temperatures and pressures. Real-time measurements of injection volume, effective grouting duration, and filling rate are analysed to uncover how grouting behaves under diverse geological conditions. The results provide practical guidance for reinforcing deep, fractured, and weak rock masses.
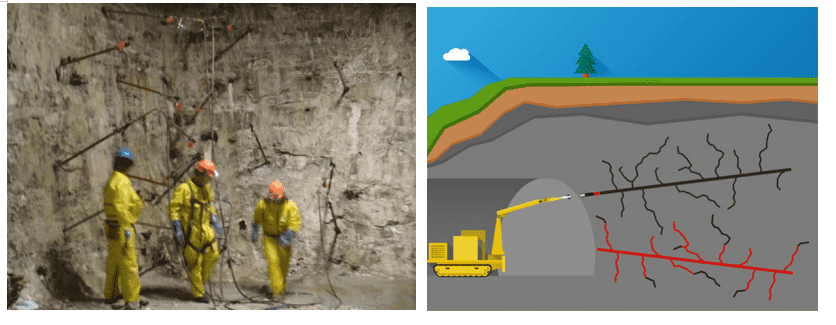
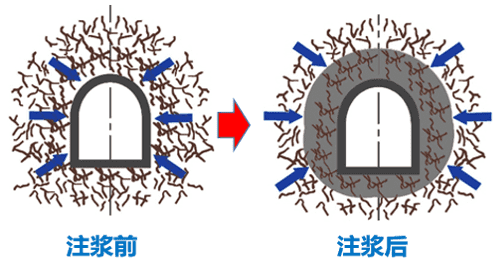
Grouting Reinforcement of Deep, Weak Fractured Rock Masses
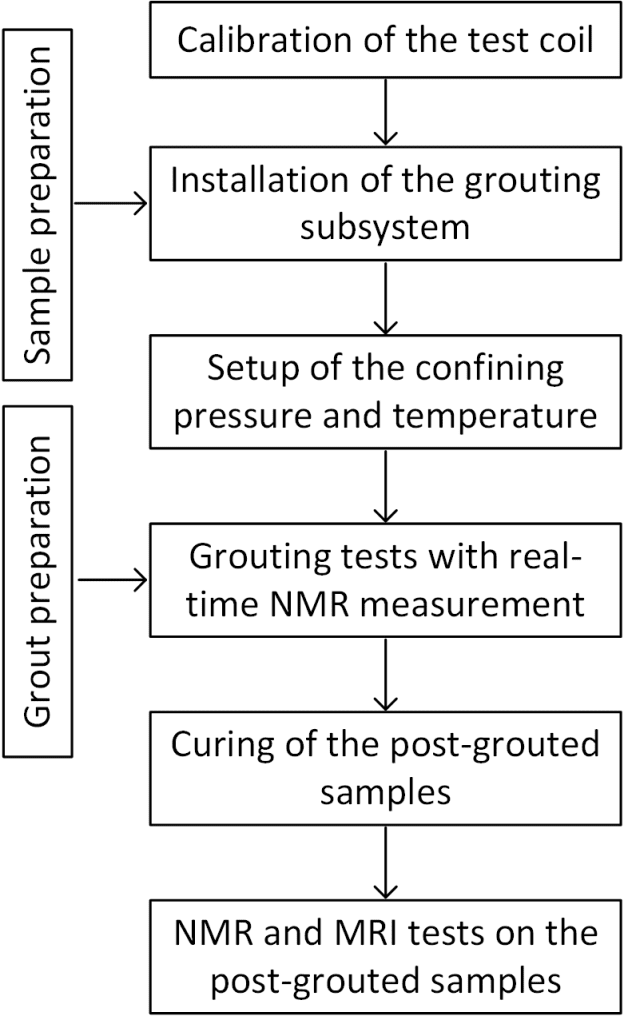
Experimental Flowchart
Raw Materials & Sample Preparation
The sandstone samples were sourced from Huang sandstone in Shandong Province, China. They are moderately weathered with medium-grained texture and moderate roundness, featuring particle sizes mainly between 0.25–0.50 mm. Each sample was cut into cylinders (25 mm diameter, 50 mm height), then sliced axially to create 1–3 continuous parallel fractures for grouting infiltration experiments.
Ultrafine cement slurry was prepared with retarders and polycarboxylate-based water reducers as additives. Pre-testing showed optimal performance with 2.0% retarder, 1.5% water reducer, and a water-cement ratio of 2:1—ensuring adequate fluidity and injectability for the tests.
Experimental System
The study employed the MacroMR12-150H-1 LF-NMR imaging and analysis system, developed by Niumag Analytical Instrument Corporation. It consists of an NMR testing module and a dual-cylinder constant-pressure and constant-flow module. This setup enables real-time analysis of grout seepage in rocks, as illustrated in Figure 1.
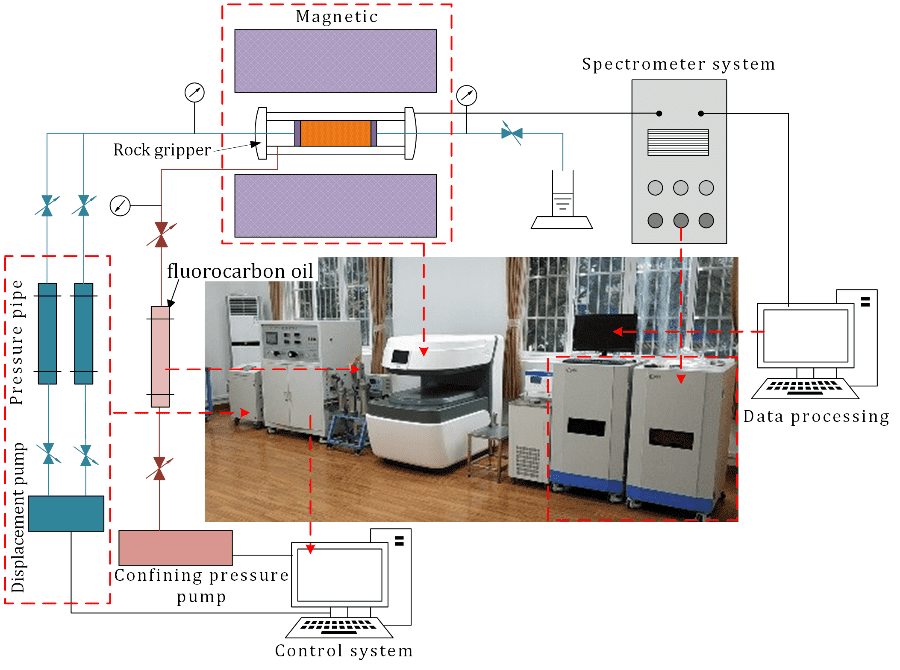
Figure 1. MacroMR12-150H-1 Real-Time LF-NMR Rock Seepage Analysis and Imaging System
Hydration Characteristics & Time-Varying Viscosity of Grout
The NMR system was used to monitor changes in T2 signal strength during slurry hydration under varying temperatures (see Figure 2). During the dormant phase, signal strength declined gradually. At room temperature (20°C), hydration spanned 5–35 minutes. Elevated temperatures (30°C, 40°C) shortened this to 5–25 minutes. Since viscosity remains stable during the dormant period, it’s optimal to complete grouting before the acceleration phase begins.
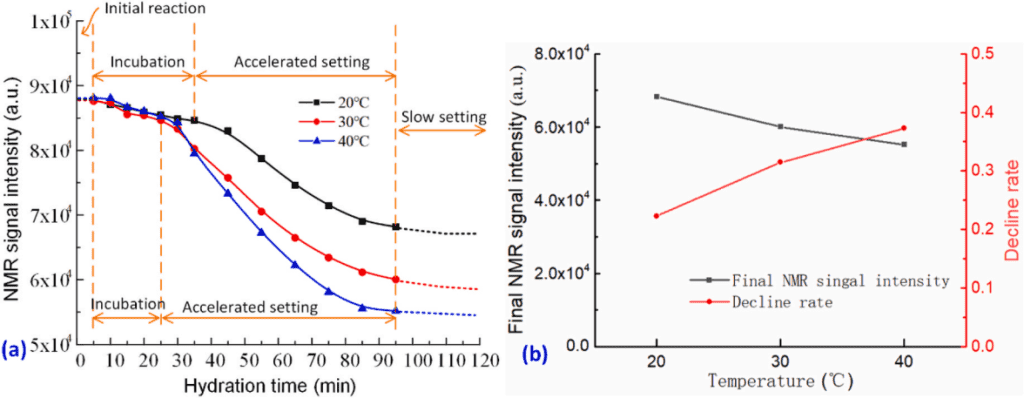
Figure 2. Evolution of NMR Signal Intensity During Slurry Hydration at Different Temperatures
Water was heated to target temperatures using a digital thermostatic bath. A digital rotational viscometer was employed to measure slurry viscosity. Rotor 0 operated at 60 rpm, and readings were taken every 5–10 minutes over a 95-minute duration until the end of the acceleration phase. Figure 3 illustrates viscosity trends. Across all temperatures, slurry viscosity increased over time. Higher temperatures led to higher final viscosity and faster growth, indicating increased resistance during grout migration, thereby reducing diffusion distance.
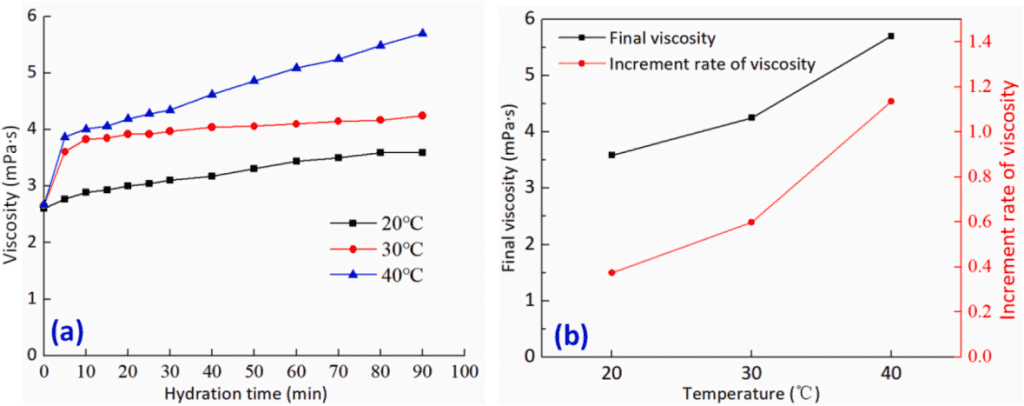
Figure 3. Viscosity-Time Curves of Slurry at Different Temperatures
01. Infiltration Characteristics in Single-Fracture Sandstone
Figure 4 shows T2 spectrum changes during grout injection at 30°C. With ongoing injection, NMR signal peak intensity and peak area increased. Initially three peaks evolved into two, as micropores and mesopores merged. The main peak shifted right, indicating longer transverse relaxation times, which reflects slurry migrating into larger pores. Analysing T2 curves allows the understanding of grout diffusion across pore scales.
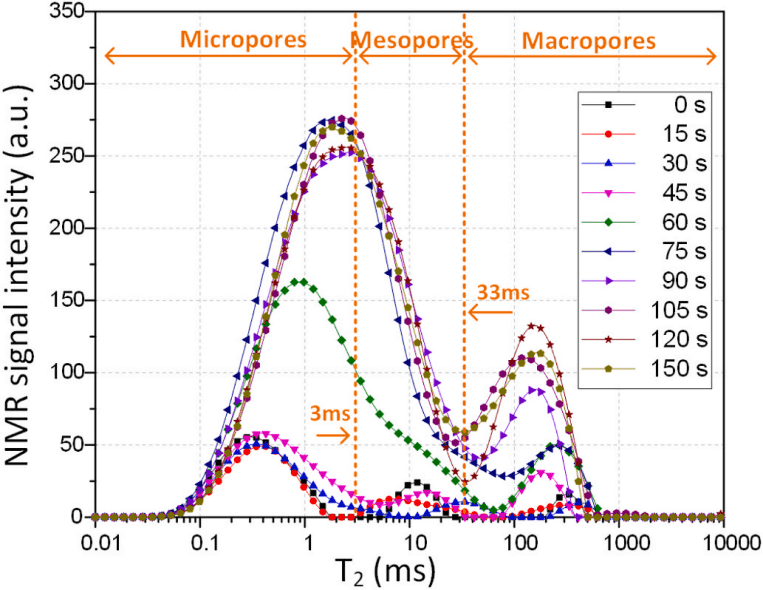
Figure 4. T2 Spectrum Evolution During Grouting in Single-Fracture Sandstone (T = 30°C)
Figure 5 illustrates the real-time NMR imaging throughout the injection. At 15 s, initial slurry diffusion appears around the fracture with minimal pixel brightness. By 45 s, grout accumulates at the inlet, increasing pixel intensity. The slurry progressively traverses the fracture, forming a continuous bright line, then disperses into surrounding pores, reaching a fully injected, stable state.
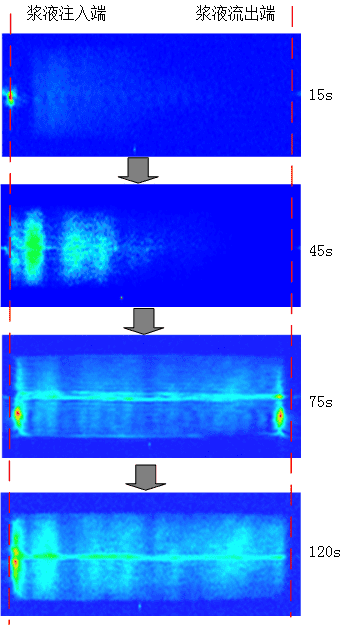
Figure 5. NMR Imaging During Grouting Process
By testing various grout volumes via LF-NMR, a quantitative relationship between signal strength and grout volume was established, allowing back-calculation of actual injected volume during grouting.
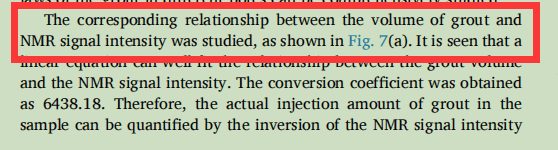
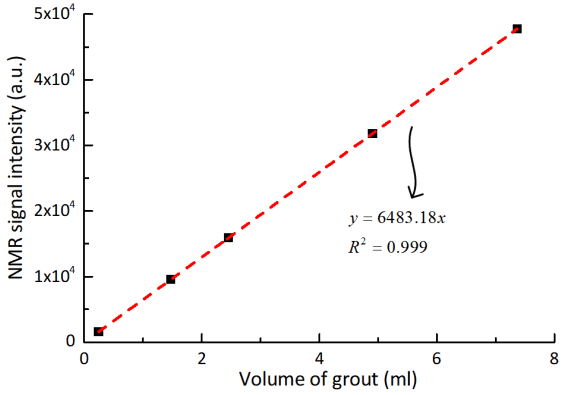
Figure 6 illustrates grout volume versus time, highlighting three distinct stages: (I) Initial Stage – low volume, pressure buildup at the inlet; (II) Effective Stage – linear volume increase and active infiltration; (III) Stable Stage – pseudo-saturation, with steady slurry outflow indicating full fracture penetration.
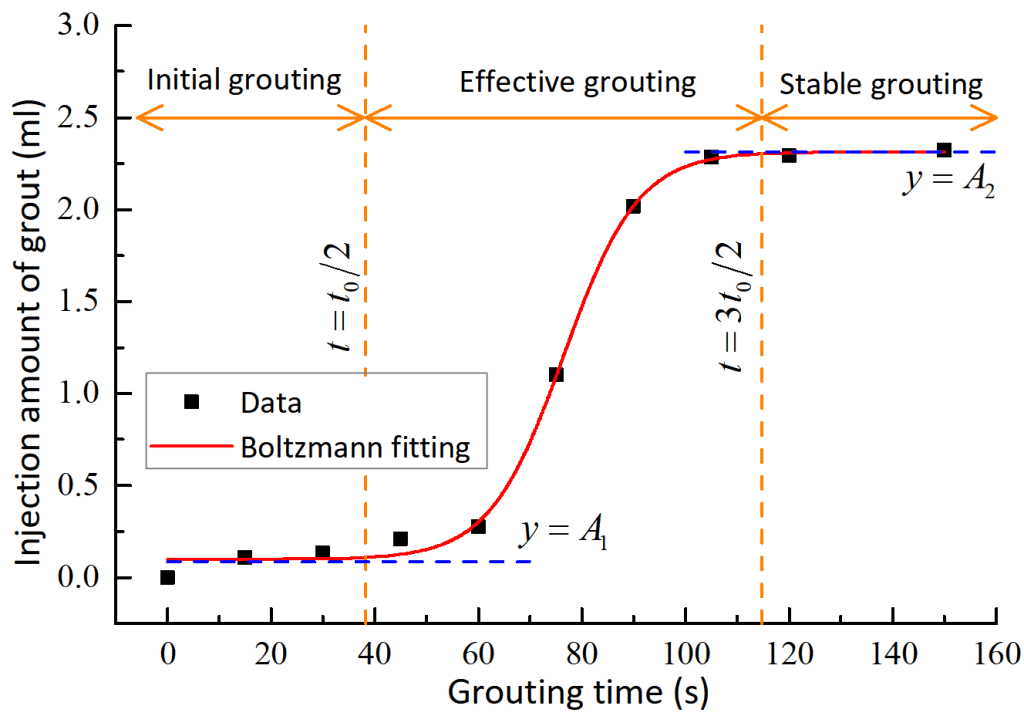
Figure 6. Grout Injection Volume vs Time
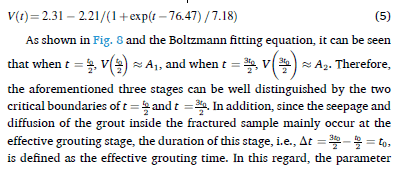
The Boltzmann function effectively fits the injection-time curve. Two key indicators are derived: Effective Injection Time (EIT) and Filling Rate (slope of the linear stage). These serve to analyse grout migration under varying conditions.
02. Effect of Temperature on Grout Diffusion
As shown in Figure 6, higher temperatures reduce final injection volume due to increased viscosity and decreased flowability. The effective injection time is prolonged, and filling rates decline non-linearly. Across all pore sizes, micropores exhibit the highest filling rate, followed by mesopores, then macropores.
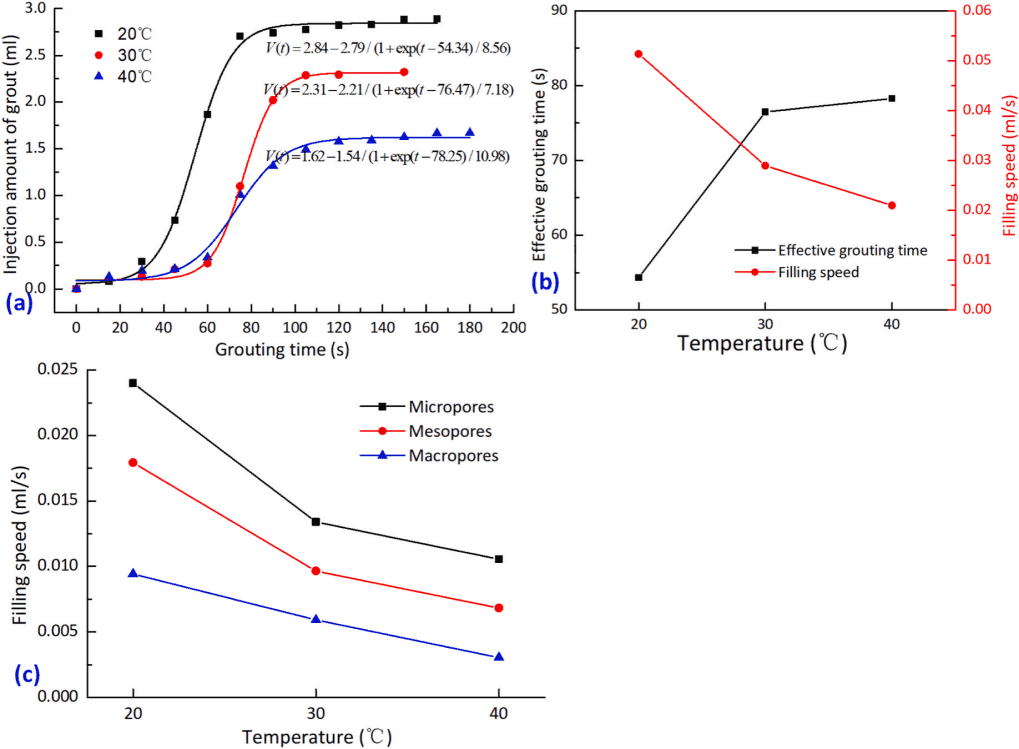
Figure 6. Impact of Temperature on Grout Diffusion
03. Effect of Confining Pressure on Grout Diffusion
As depicted in Figure 7, increasing confining pressure reduces final grout volume. While effective injection times remain similar across pressures, the filling rate drops at higher pressures, with sensitivity to pressure changes diminishing. At high pressures, slurry preferentially enters micropores; only once these are saturated does it migrate to larger pores.
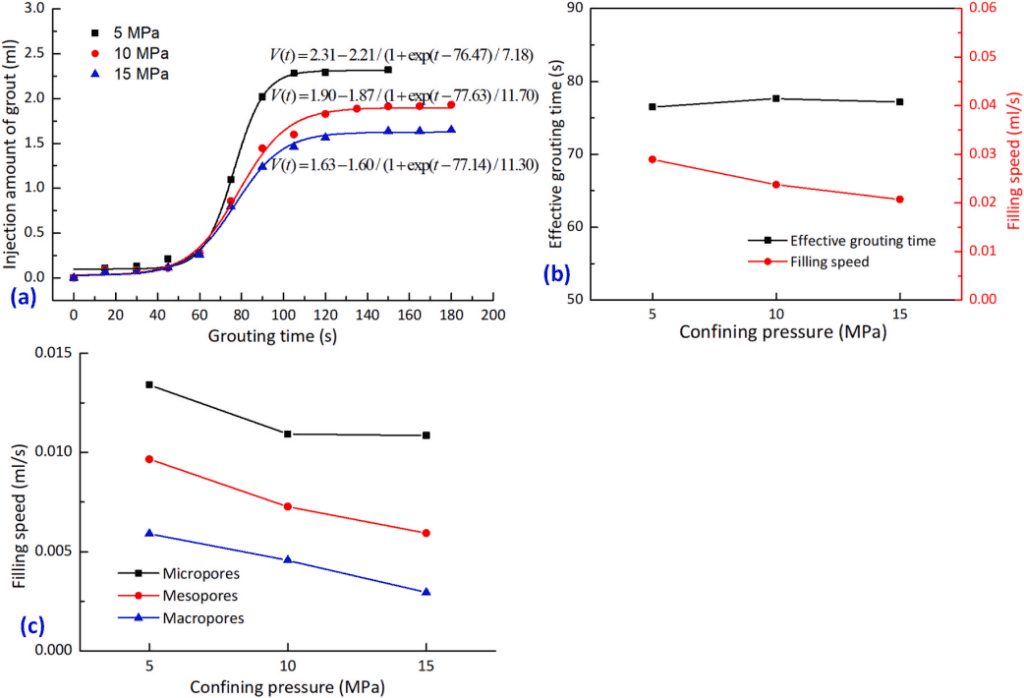
Figure 7. Impact of Confining Pressure on Grout Diffusion
04. Effect of Slurry Flow Rate on Diffusion
As shown in Figure 8, final injected volumes were consistent (~2.3 ml), regardless of flow rate. However, faster injection rates led to shorter grouting times and higher filling rates. Higher flow rates also facilitated preferential migration into micropores, similar to high-pressure scenarios, forming dominant channels early on.
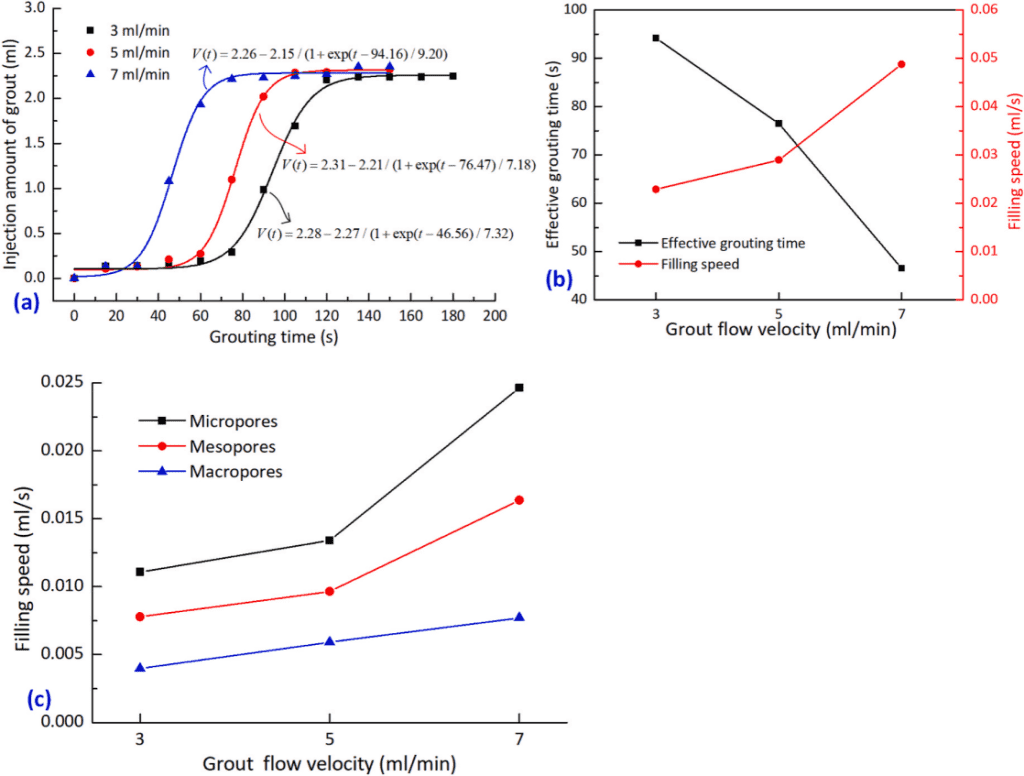
Figure 8. Effect of Slurry Flow Rate on Diffusion
05. Effect of Fracture Count on Diffusion
Figure 9 reveals that multi-fracture samples had shorter onset times and greater grout volumes than single-fracture ones. As fracture count increased from 1 to 3, both effective injection time decreased and filling rate increased. However, pore-scale diffusion patterns remained uniform across fracture counts, indicating no dominant channels formed.
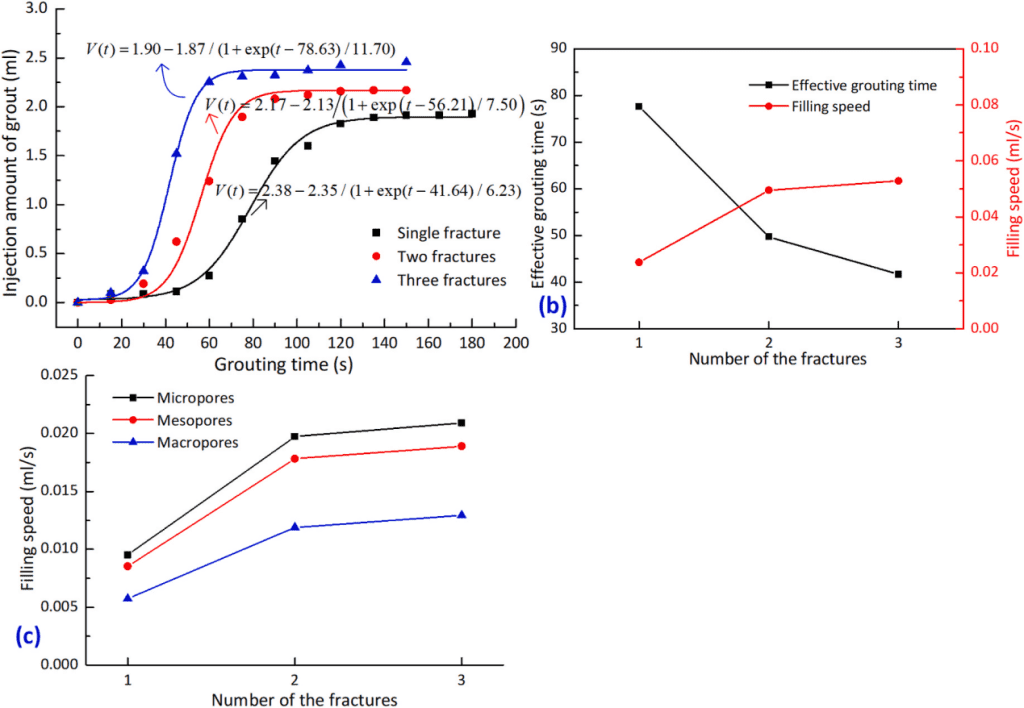
Figure 9. Impact of Fracture Count on Diffusion
The MacroMR12-150H-1 LF-NMR real-time online analysis and imaging system used in this study was equipped with a high-pressure and high-temperature displacement system. It is primarily designed for studying fluid seepage and gas-liquid two-phase displacement in porous media. In this article, the system was employed for the following key functionalities:
Key LF-NMR Contributions in This Study:
Key Takeaways

 Scan QR Code
 Scan QR Code
Phone: 400-060-3233
After-sales: 400-060-3233


Back to Top