
In recent years, natural gas hydrates have attracted increasing attention worldwide as a clean and efficient emerging energy source. China possesses abundant natural gas hydrate resources, with a geological resource volume of 1.53×10¹⁴ cubic metres and a technically recoverable volume of 5.3×10¹³ cubic metres. Unlike conventional natural gas reservoirs, hydrate-bearing formations are mineralogically complex, primarily consisting of muddy siltstone, with predominantly small pores and extremely low permeability. This article introduces an SCI study published in the leading oil and gas journal Fuel, which experimentally simulates hydrate formation and demonstrates how low-field NMR can be leveraged to investigate hydrate formation conditions and mechanisms.
The key aspect of this methodology is using NMR to quantify natural gas hydrate formation. NMR detects hydrogen in water; during hydrate formation, liquid water converts to solid water, in which hydrogen nuclei produce no signal. Knowing the hydrate molecular formula is CH₄·6H₂O, six units of water yield one unit of hydrate. Therefore, the decrease in NMR water signal directly reflects hydrate saturation. Although hydrogen in methane gas also produces NMR signals, it is negligible compared to liquid water and can be ignored in this context.
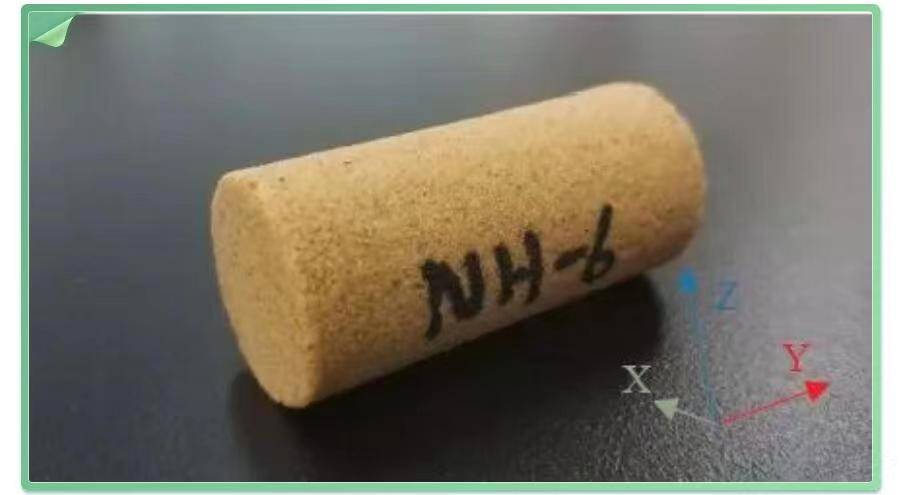
Figure 1 Sandstone Core Sample
Low-field NMR examines the behaviour of hydrogen nuclei in reservoir fluids under an applied magnetic field. When the nuclei absorb RF pulses of a specific frequency, they resonate and return to equilibrium. By measuring the transverse relaxation time T₂, the fluid characteristics within rock pores can be analysed. The T₂ distribution is influenced by surface relaxation, bulk relaxation, and diffusion relaxation, expressed as:

Where: T2S – surface relaxation, ms;
T2B – bulk relaxation, ms;
T2D – diffusion relaxation, ms;
This experiment uses a uniform magnetic field, so diffusion relaxation is negligible. Since the interaction between fluid and pore surface is strong, T2S ≪ T2B, allowing 1/T2B to be ignored. The equation then simplifies to:

Where: S is the pore surface area; V is the pore volume;
Which can be further expressed as:

Thus, the relaxation time T₂ is proportional to pore radius and inversely proportional to relaxation rate: shorter T₂ indicates smaller pore radius.
This low-field NMR experiment used a MacroMR12-150-I large-bore NMR imaging analyser (Suzhou Newmae). The permanent magnetic field strength is 0.3T, with a coil diameter of 70mm.
The hydrate formation process in partially saturated sandstone was studied using an excess gas method under constant temperature and pressure. The experimental setup is shown in Figure 2. The procedure comprises six steps:
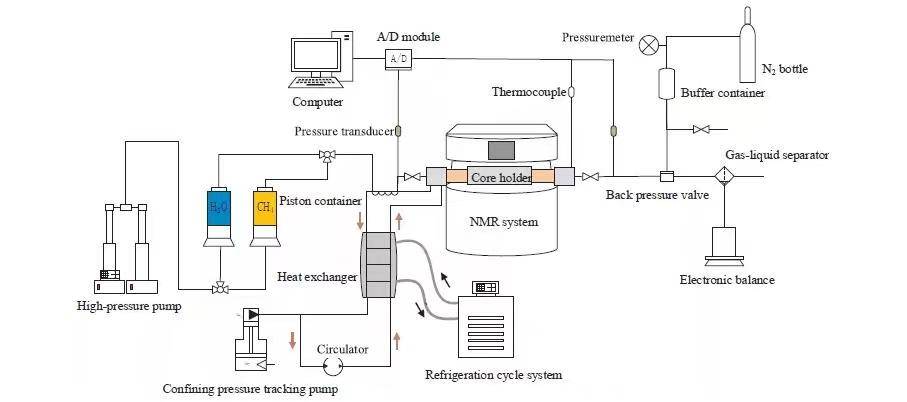
Figure 2 Laboratory Hydrate Simulation Setup
(1) The core holder was maintained at 2°C using a cooling loop. Heavy water standards were used to calibrate NMR signals, producing an excellent linear relationship between water mass and NMR signal (Figure 3).
(2) NMR measurements of dry samples were performed to eliminate background signals.
(3) The sandstone sample was vacuum-saturated with water, yielding 5.27 g of internal water.
(4) Saturated sandstone was placed in the core holder, and water was injected until pore pressure reached 5 MPa, while confining pressure minus pore pressure was kept constant at 4 MPa.
(5) Methane was injected, displacing 1.95 g of water, then the outlet valve was closed, and gas was further injected until pore pressure reached 5 MPa. Constant pressure conditions ensured that all observed NMR water peak changes were due to hydrate formation.
(6) NMR T₂ spectra and MRI scans were alternated until hydrate formation was complete.
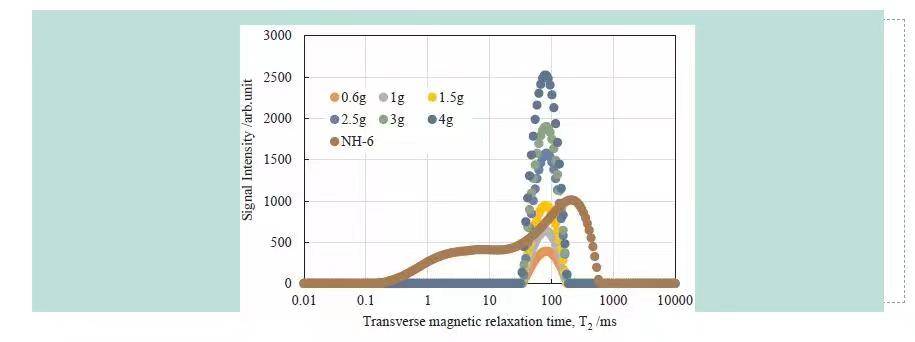
Figure 3 NMR Calibration and Saturated Sandstone T₂ Spectrum
1) Changes in Material Content
Figure 4 shows water, methane, and hydrate saturation changes over time, calculated from NMR T₂ spectra. Using the excess gas method ensures sufficient methane during hydrate formation, so liquid water reduction corresponds directly to solid hydrate formation.
Hydrate forms rapidly at the early stage, slowing over time. By the end, water, methane, and hydrate saturations were 33%, 29%, and 38%, respectively. Prior studies indicate hydrates only form at higher initial water saturation; this experiment confirms that hydrate formation ceases when liquid water saturation drops below 30–40%. Hence, both temperature-pressure conditions and liquid content critically influence hydrate formation.
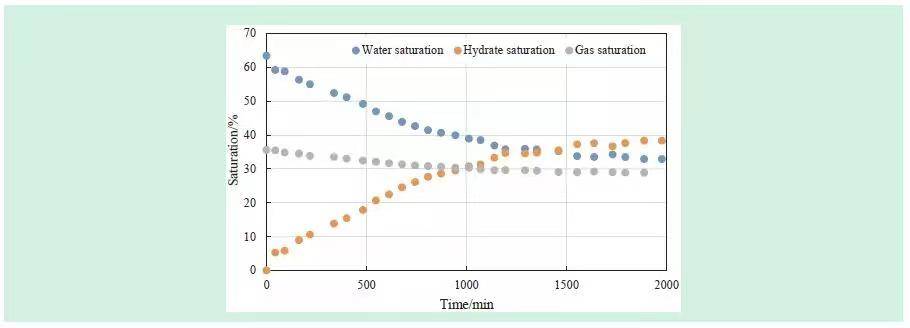
Figure 4. Saturation Changes During Hydrate Synthesis
2) MRI Imaging of Hydrate Formation
Figure 5 displays NMR imaging during hydrate formation. The Y-axis represents core length, and XZ slices are circular. Stronger signals (yellow) indicate more liquid water. Results show heterogeneous water distribution after methane injection: more gas at the inlet, less water. As hydrate forms, water content decreases, becoming more uniform upon completion.
Figure 6 shows NMR signal intensity along the Y-axis. Both absolute amplitude and fluctuation decrease over time. Signals after 1800 minutes reflect more uniform bound water, consistent with MRI observations.
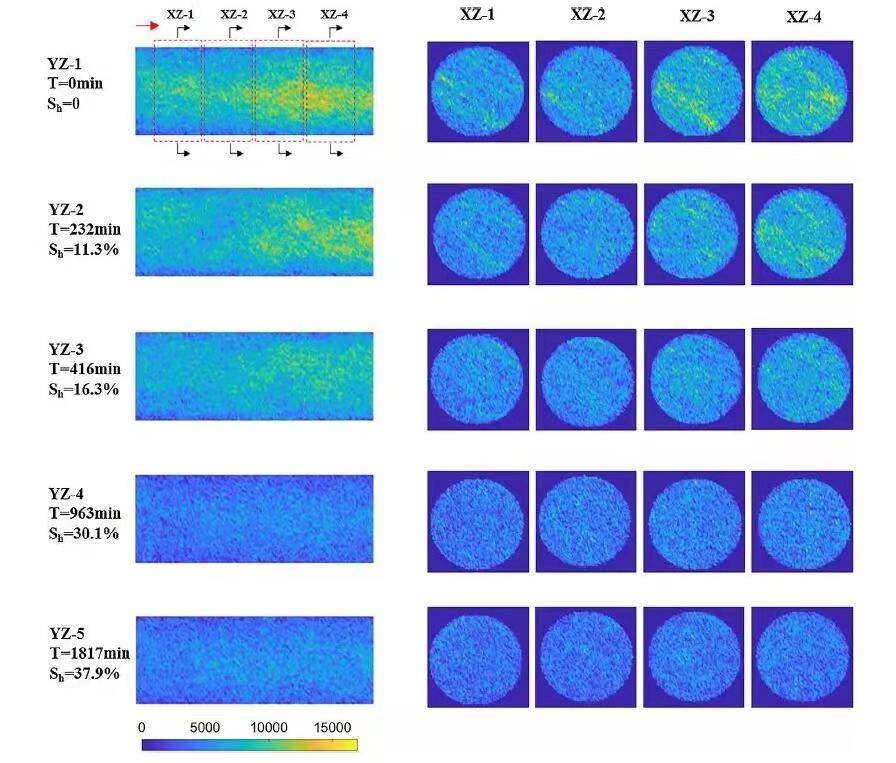
Figure 5. MRI Images at Different Slices
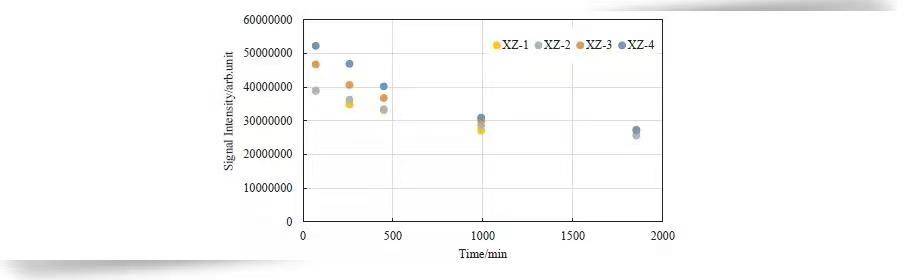
Figure 6. NMR Signal Intensity Distribution at Different Slices
Figure 7 illustrates signal amplitude variations across four sections from inlet (XZ-1) to outlet (XZ-4). Water reduction is more pronounced near the outlet, and after complete hydrate formation, water saturation across sections is almost equal.

Figure 7. NMR Signal Amplitude Variation Along Core Length
 Scan QR Code
 Scan QR Code
Phone: 400-060-3233
After-sales: 400-060-3233


Back to Top