
With the continued development of hydraulic and hydropower engineering, the construction of large-scale hydraulic structures such as reservoirs and dams has entered a phase of rapid growth. During extensive geological transformations, engineers must tackle not only complex geological and rock mechanics challenges but also overcome environmental factors such as fluctuating water levels, rainfall, and evaporation, which threaten the stability of rock and soil masses.
1. Basic Concept:
Twenty-five samples were extracted from the same rock mass and divided into five groups (five samples per group). Each group underwent 1, 5, 10, 15, and 20 wetting–drying cycles, respectively. After each cycle, nuclear magnetic resonance (NMR) and stress–strain tests were conducted on the saturated core samples. The changes in pores, cracks, and stress–strain curves were then compared and analyzed.
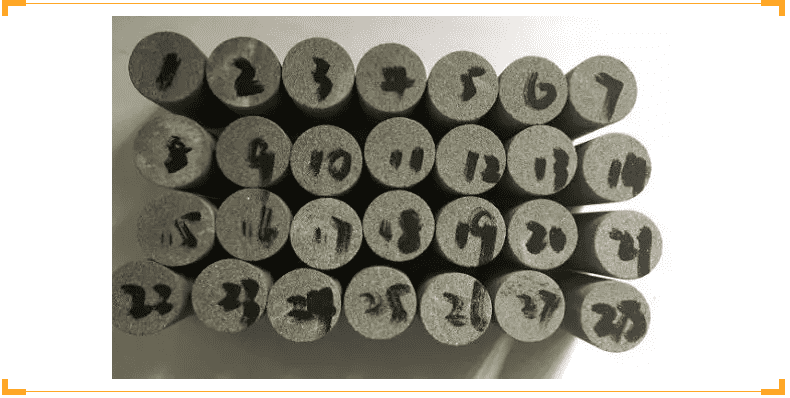
Figure 1. Photograph of mudstone sandstone specimens
2. Changes in NMR T2 Distribution:
Figure 2 shows the T2 distribution spectra of mudstone sandstone samples subjected to different numbers of wetting–drying cycles. After the first cycle, the initial pore size distribution appears uniform. As the number of cycles increases, internal pores gradually expand, and numerous micropores emerge (leftward peak rises). When the cycle count exceeds 10, significant internal damage and the development of microcracks occur (highlighted by the rightward peak). Beyond 15 cycles, peak changes become minor, and spectral area growth levels off.
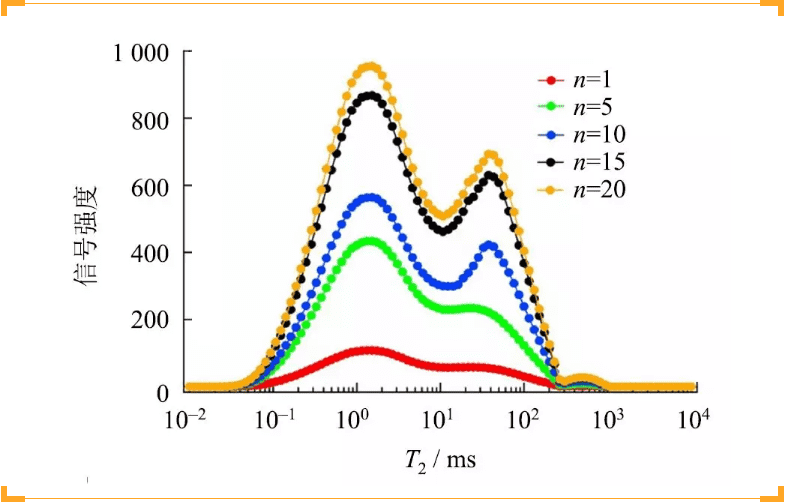
Figure 2. NMR T2 spectra of mudstone sandstone after different wetting–drying cycles
The total area under the T2 spectrum represents the total pore volume within the rock. Since the spectral area is proportional to the amount of fluid in the rock, it directly reflects porosity. By analyzing the average spectral area across different cycles, we establish a correlation between porosity and wetting–drying cycles (Figure 3), which exhibits a clear exponential relationship.
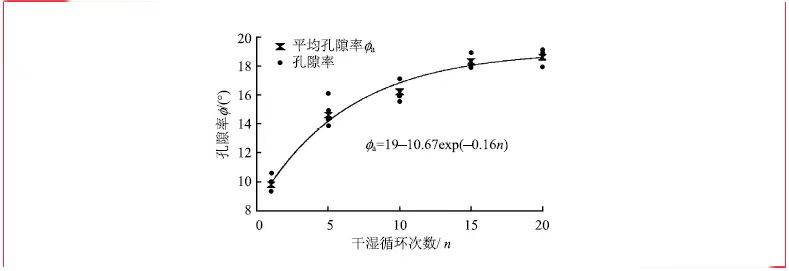
Figure 3. Relationship curve between porosity and wetting–drying cycles
In proton-weighted imaging, brighter pixels indicate a higher concentration of hydrogen nuclei, meaning higher water content. Figure 4 presents MRI scans of the same rock sample under various cycle states. Bright regions denote fluid-filled pores; varying brightness corresponds to different water-saturated pore levels. Higher grayscale values imply greater moisture within pores and cracks. Denser pixel clusters indicate more developed pore and fracture networks.
As the number of cycles increases, internal pores enlarge and interconnect, forming microcracks that propagate. The changes observed in MRI scans correspond closely with those seen in SEM images under the same conditions (Figure 5).
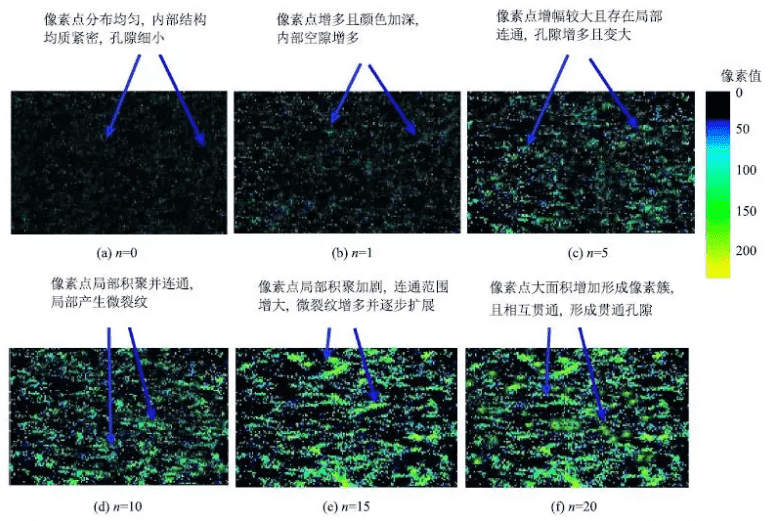
Figure 4. MRI results of mudstone sandstone after wetting–drying cycles
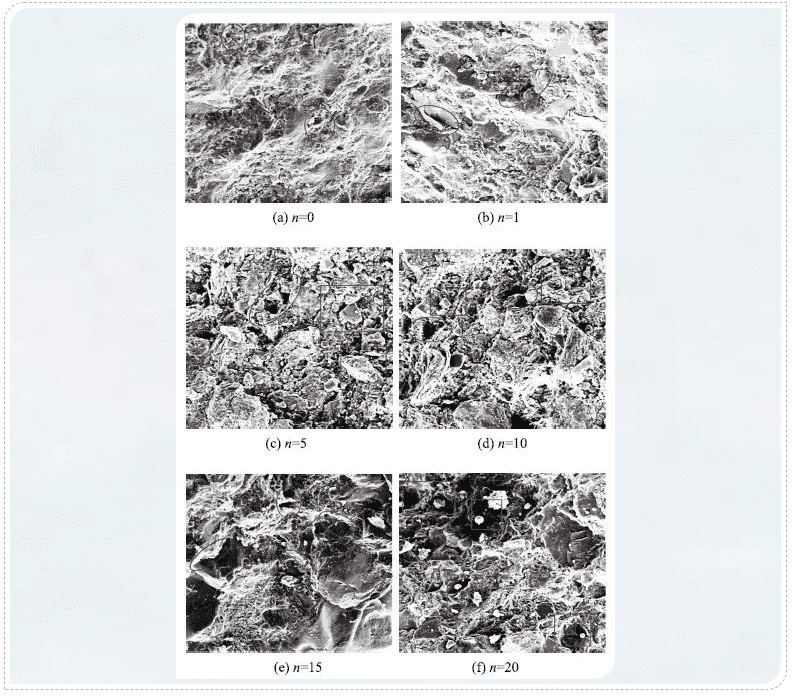
Figure 5. SEM images of mudstone sandstone under varying wetting–drying cycles
In NMR imaging, grayscale values integrate parameters like spin density, T1, and T2 relaxation times as spatial functions. Spatial data is encoded and arranged into a matrix, and 2D Fourier transformation provides a signal intensity map of internal structures. Figure 6 shows grayscale probability density functions of MRI images across cycles. As water–rock interactions intensify, the proportion of high grayscale values increases, indicating structural degradation. The shift in grayscale distribution reveals the degree of internal transformation—the convergence of mean values signals diminishing structural uniformity.
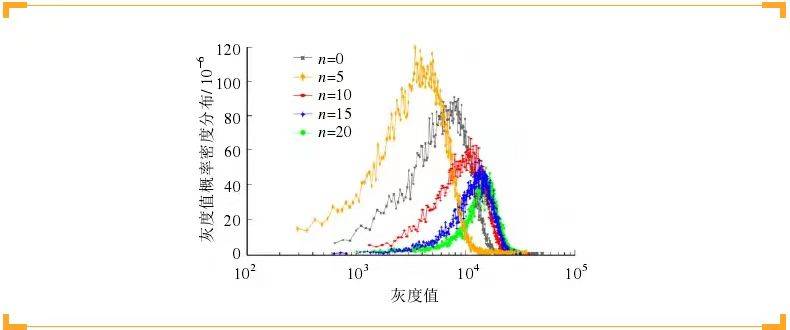
Figure 6. Probability distribution of grayscale values across cycles (MRI)
4. Stress–Strain Relationship:
Figure 7 illustrates the uniaxial compressive stress–strain curves after different wetting–drying cycles. In the pre-peak stage, mechanical behavior remains similar across cycles. However, post-peak characteristics vary significantly. Samples subjected to fewer cycles display long elastic stages, higher elastic moduli, and shorter plastic phases—typical brittle failure. With more cycles, the elastic modulus decreases, indicating a transition from brittleness to ductility. Even after reaching peak stress, samples retain residual strength, with ductile behavior becoming increasingly prominent.
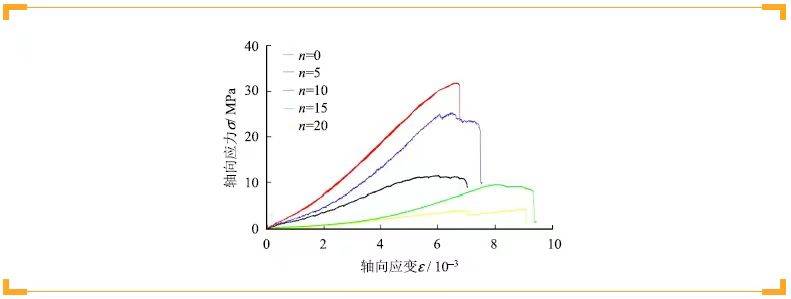
Figure 7. Uniaxial compressive stress–strain curves
Since wetting–drying cycling introduces cumulative damage to mudstone sandstone samples, a relationship between peak stress and cycle number can be established (Figure 8). The average peak stress across all sample groups exhibits an exponential decline as the number of cycles increases.
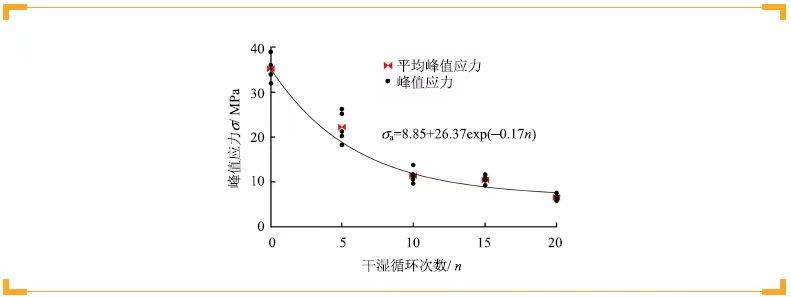
Figure 8. Relationship curve between peak stress and cycle number
5. Analysis and Discussion:
Figure 5 shows that, with increasing wetting–drying cycles and under physical and chemical water–rock interactions, water infiltrates the rock, causing cementing materials to hydrolyze. Originally dense and homogeneous mudstone sandstone gradually disintegrates into loose particles. Pores expand, microcracks emerge, and permeability increases. Consequently, cohesion and friction between grains reduce. Given the angular and coarse-grained nature of mudstone sandstone, hydration deepens erosion, leading to spalling and weakening of interparticle friction. Could this increasing porosity be directly linked to mechanical parameters like strength?
Figure 9 demonstrates the relationship between porosity and peak stress. A clear negative correlation is observed—higher porosity corresponds to lower peak stress.
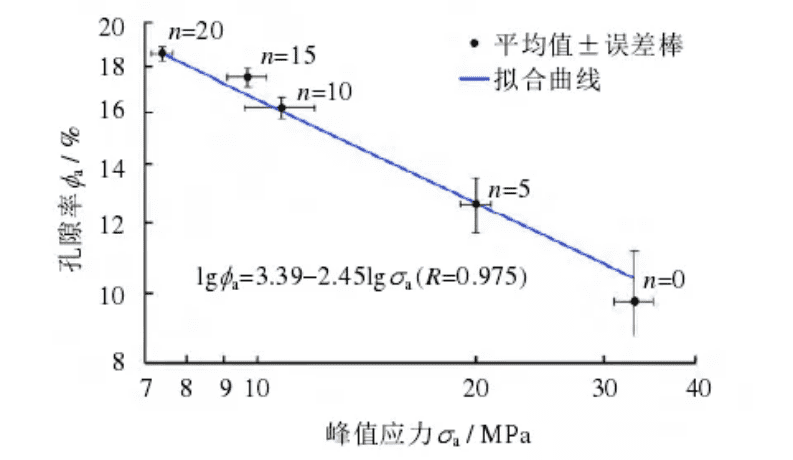
Figure 9. Relationship between peak stress and porosity
6. Conclusion:
This study employs advanced low-field nuclear magnetic resonance (LF-NMR) techniques. The evolving T2 spectrum characterizes the deterioration mechanisms of mudstone sandstone under wetting–drying cycles. NMR imaging (non-destructive) intuitively reveals internal degradation processes over time.
Reference: Xie Kainan, Jiang Deyi, Sun Zhongguang, Song Zhongqiang, Wang Jingyi, Yang Tao, Jiang Xiang. Effect of Wet–Dry Cycles on the Microstructural Degradation of Mudstone Sandstone Based on Low-Field NMR [J]. Rock and Soil Mechanics, 2019, 40(02): 653–659.
 Scan QR Code
 Scan QR Code
Phone: 400-060-3233
After-sales: 400-060-3233


Back to Top