
Carbon materials are commonly used as anode materials in ion batteries. However, the theoretical capacity of commercial graphite has nearly reached its limit, making further performance improvements challenging. Therefore, exploring next-generation electrode materials for ion batteries is crucial.
When used as anode materials in ion batteries, porous carbon offers several advantages: its high specific surface area allows for more ion storage, providing high capacity; complex multi-dimensional pore structures create efficient diffusion pathways, shortening ion transport distances; vacancies and heteroatom doping act as additional storage sites; during ion insertion and extraction, mechanical stress from volume expansion/contraction is minimal, ensuring excellent cycle stability. Consequently, porous carbon often exhibits superior electrochemical performance compared to traditional graphite.
Porous carbon can be categorised by pore size into microporous (pore diameter <2 nm), mesoporous (2–50 nm), and macroporous (>50 nm) types. In new energy battery applications, microporous and mesoporous carbons are most commonly used. The preparation method and choice of precursor directly affect the material’s performance and application range. Over the past decades, extensive work has been conducted on designing and tuning pore size, surface chemistry, and structure of nanoporosity in carbon materials.
This study employs low-field nuclear magnetic resonance (LF-NMR) to investigate the pore size distribution of porous carbon[1].
Porous carbon materials used in batteries are distinct from general porous materials: they are powders, primarily microporous, with narrow pore size distribution. Conventional pore size measurement methods, such as mercury intrusion, are unsuitable for these materials.
Common testing methods include gas adsorption and low-field NMR[2].
Gas adsorption measures specific surface area based on the principle that gas molecules physically adsorb reversibly on the surface of solid particles (adsorbent) at very low temperatures. At a given pressure, a predictable equilibrium adsorption amount occurs.
By measuring this equilibrium adsorption and applying theoretical models, the sample’s specific surface area, pore volume, and pore size distribution can be calculated.
Common adsorbates include nitrogen, argon, carbon dioxide, and krypton. However, the precision of nitrogen adsorption depends heavily on the instrument used. High-precision devices require extended measurement times, sometimes up to a week per sample, which cannot meet the fast-paced demands of modern industrial production[3].
Low-field NMR leverages hydrogen’s high detectability to accurately measure water signals in pores of porous carbon. Using a calibration curve, the relationship between NMR water signal and water mass can be established, enabling calculation of sample porosity. With known surface relaxation rates, the T2 relaxation spectrum can be modelled to rapidly determine pore size distribution.
Compared to gas adsorption, LF-NMR offers significant speed advantages, reducing measurement time from tens of minutes—or even up to a week—to under 2 minutes. It is non-destructive and allows repeated measurements[4].
Using low-temperature LF-NMR, the porosity of porous carbon can be measured, and with known surface relaxation rates, the pore size distribution can be rapidly determined.
Main experimental procedure:
1. Fill a chromatography vial with approximately 1 ml of water and weigh after removing the container cap.
2. Place each of the four customer-provided porous carbon samples into separate chromatography vials with water. Gently shake until the carbon is fully submerged. Weigh to determine the net weight of the carbon added.
3. Transfer the vials to a vacuum saturation device. Remove air from the vials to saturate the pores with water. Saturated water serves as the measurement target for porosity and pore size distribution.
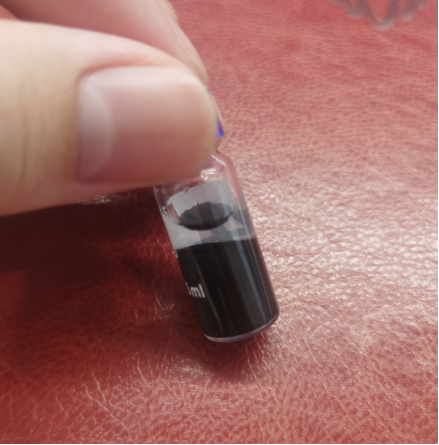
Vacuum-treated porous carbon sample
4. After vacuum saturation, transfer the samples to the NMR instrument. Using liquid nitrogen, stabilise the temperature at -6℃, calibrate the frequency, and sequentially test each sample once thermal equilibrium is reached.
5. Perform calibration with standard samples to relate NMR signals to water mass in the pores, along with baseline measurements.
6. Establish a calibration curve and calculate the sample’s porosity from its NMR signal.
7. Input the porosity data into software to calculate the pore size distribution of the porous carbon.
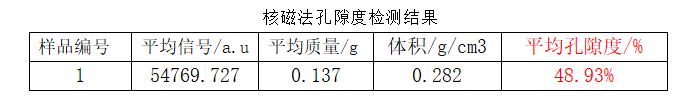
Porosity results measured via LF-NMR for a sample are shown below:
Pore size distribution measured via LF-NMR for the same sample:
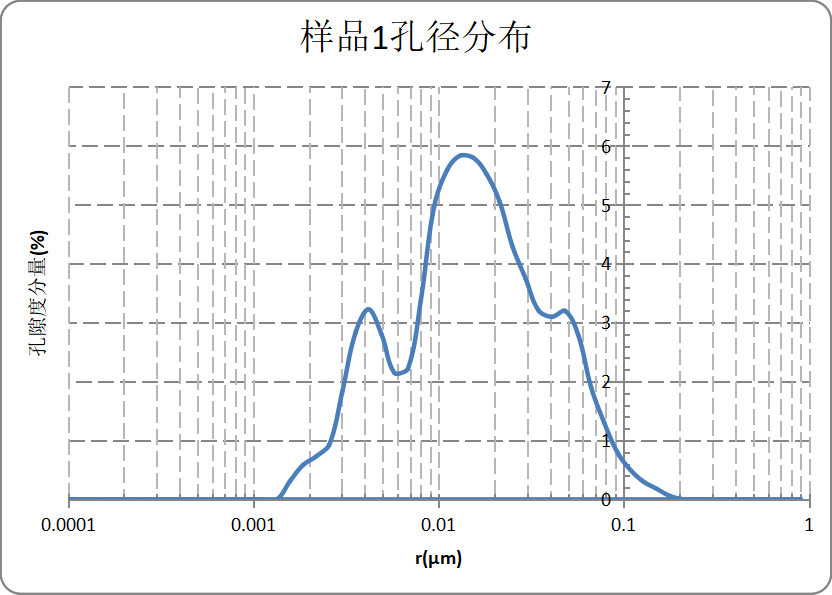
Peak pore size distribution for this porous carbon sample:

Based on software modelling, LF-NMR provides a complete pore size distribution. This sample has a porosity of 48.93%, with the primary peak at 13 nm corresponding to a pore volume fraction of 5.83% (highlighted in red in the figure above).
LF-NMR can quickly measure porosity and pore size distribution in porous carbon, enabling rapid quality control in industrial production, optimisation of processes and formulations, and evaluation of different batches. Larger-pore porous carbon can be prioritised for anode applications, providing more efficient ion diffusion pathways and additional storage sites, ultimately enhancing battery performance.
[1] Xia W, Mao Y, Xie G, et al. Role of sodium oleate in the in-situ pore wetting of porous active carbon by 1H LF-NMR: Implications for porous mineral flotation[J]. Powder Technology, 2021, 392:116-122.
[2] Wang A, Chen W, Liu S, et al. Layered porous carbon material derived from food residues and its application for elemental mercury adsorption in flue gas[J]. Fuel, 2023, 335:126876.
[3] Toshihide Horikawa, Noriyuki, et al. Preparation of nitrogen-doped porous carbon by ammonia gas treatment and the effects of N-doping on water adsorption[J]. Carbon, 2012, 50(5):1833-1842.
[4] Mao Y, Xia G. Relationship model between pore wetting and floatability
 Scan QR Code
 Scan QR Code
Phone: 400-060-3233
After-sales: 400-060-3233


Back to Top