
Objective To qualitatively and quantitatively analyse the wetting agent (ethanol) during high-shear granulation using low-field nuclear magnetic resonance time-domain technique (LF-NMR) and low-field magnetic resonance imaging (LF-MRI). Methods Vitamin C Yinqiao Tablets (VCYT) prepared by high-shear wet granulation were used as the study model. An LF-NMR method was established to determine wetting agent dosage. Transverse relaxation time (T2) and 2D images acquired by LF-MRI were used to qualitatively assess the distribution and dynamics of the wetting agent. The relationship between peak area (A2) and granule yield was investigated. Results The wetting agent dosage correlated well with A2 (R2 = 0.9575). As wetting agent dosage increased, T2 shifted to the right and A2 rose, indicating more protons. LF-MRI showed progressively clearer images with higher wetting agent levels, i.e., non-bound protons (bound-state and free-state protons collectively) increased within the granules. When the wetting agent reached 20%–25%, the content of bound-state protons no longer increased and granule yield peaked. Conclusion LF-NMR and LF-MRI can rapidly and accurately detect changes in wetting agent dosage and distribution during granulation, providing an evaluation approach to elucidate the impact of wetting agents on granule properties and forming mechanisms.
Vitamin C Yinqiao Tablets (VCYT) are commonly used to treat colds. With proven efficacy and affordability, they are a mainstay in the cold-medicine market [1]. A review of the last five years of literature shows a focus on quality standards, with limited reports on manufacturing processes. We therefore investigated the granulation process for VCYT. Granulation is a critical step in solid dosage manufacturing, aiming to improve physical properties such as morphology, particle size, and bulk/tapped density. The dosage and distribution of binder/wetting agent are crucial: insufficient wetting agent leads to fluffy granules or excess fines with poor flow, impeding downstream processing; excessive wetting agent can cause over-granulation [2] or overly dense granules that affect tablet dissolution and hardness [3]. Uneven distribution yields broad size distributions and large agglomerates. Traditional assays for wetting agent dosage—Karl Fischer titration and loss-on-drying [4]—involve toxic solvents and are time-consuming. Non-destructive methods such as IR and NIRs [5] have emerged, yet they struggle to directly characterise the internal binding states of wetting agents within granules. Liao Zhenggen et al. [6] used sodium fluorescein as a tracer to indicate binder distribution; however, this assumes homogeneous tracer distribution and ignores potential encapsulation within granules [7]. HPLC determination of fluorescein entails lengthy sample prep, solvent safety concerns, and sampling accuracy issues. Thus, a simple, direct, rapid, and accurate technique to quantify wetting agent dosage and distribution is urgently needed.
LF-NMR and LF-MRI apply radio-frequency pulses at the Larmor frequency to samples in a static magnetic field, exciting protons from the low-energy to the high-energy state. Protons then return non-radiatively, releasing energy—nuclear magnetic resonance. By analysing spin-relaxation behaviours, we infer proton mobility and, at the microscopic level, the physico-chemical environment within the sample. Ethanol–water mixtures of different volume fractions are common wetting agents in TCM granulation and contain abundant protons; LF-NMR can measure proton concentration and mobility of the wetting agent to derive its content and spatial distribution within granules. The technique is rapid, non-destructive, accurate, and reagent-free for tracking moisture changes, and is widely used in food and processing industries [8–9]. Liu Jiajia et al. [10] applied LF-NMR to study hygroscopicity of dry extracts; Wu Shuangshuang et al. [11] used it to investigate water content and states in granules. These works focus on water; ethanol dynamics during granulation have scarcely been reported.
In this study, VCYT wet granulation was used to monitor changes in bound-state, constrained (semi-bound) state, and free-state protons of the wetting agent via LF-NMR and LF-MRI, and to explore correlations with granule yield, providing an evaluation method to clarify how wetting agents affect granule attributes and forming mechanisms.
High-shear granulator, models LHSH3/6/12, Hanlin Hanyu (Tianjin) Industrial Co., Ltd.; LF-NMR analysis and imaging system, model NMI20-025V-I, Shanghai Niumag Corporation; Electronic analytical balance, model AL204, Mettler-Toledo; Electric thermostatic blast drying oven, model DHG-9050A, Shanghai Yaoshi Instrument Factory; Standard sieve shaker, model 300T, Xinxiang Dahan Vibration Machinery Co., Ltd.
VCYT dry extract powder, prepared by the National Engineering Research Center for Manufacturing Technology of TCM Solid Preparations, TCM Laboratory, batch No. 20190901; Paracetamol (acetaminophen), Anhui Fengyuan Likang Pharmaceutical Co., Ltd., batch No. 011708232; Chlorpheniramine maleate, Beijing Consino Biotechnology Co., Ltd., batch No. 19052283; Soluble starch, Xi’an T&Z Pharmaceutical Excipients Co., Ltd., batch No. 20190709; Dextrin, Anhui Sunhere Pharmaceutical Excipients Co., Ltd., batch No. 190706; Ethanol, Yonghua Chemical Technology Co., Ltd., batch No. 20181113; Purified water.
Weighed 3 kg total of APIs and excipients per the formula and charged them into a high-shear granulator. After mixing for 5 min at an impeller speed of 300 r/min and a chopper speed of 700 r/min, granulation commenced. The wetting agent was 75% ethanol. During granulation, the impeller speed was 700 r/min and the chopper speed 2500 r/min. Every 60 s, 20 mL of wetting agent was added until a “slurry” state was observed, then granulation was stopped. Four batches were prepared. For each, about 20 g samples were taken from three different positions at the same depth in the bowl, collected into vials, sealed, and kept for analysis.
2.2.1 LF-NMR acquisition parameters Take 2 g of wet granules from Section 2.1, transfer into a φ 26 mm NMR tube, and place in the probe. Magnet temperature: (32.00 ± 0.02) ℃; resonance frequency: 20.679 MHz. Acquire signals using the CPMG sequence. Parameters: sampling bandwidth (SW) 200 kHz; 90° hard-pulse width (P1) 6.52 μs; 180° hard-pulse width (P2) 11.52 μs; repetition delay (TW) 1000 ms; number of scans (NS) 128; echo time (TE) 0.1 ms; number of echoes (NECH) 5000.
2.2.2 Loss-on-drying (LOD) Per Chinese Pharmacopoeia 2020, Vol. IV, General Rule 0832 (Method II) [12]. Weigh 3 g of granules from Section 2.1, spread evenly in a pre-dried flat weighing bottle, and record mass m0. Dry at 105 ℃ for 5 h with the cap open, cap the bottle, cool in a desiccator for 30 min, and record mass m1. Dry again at 105 ℃ for 1 h with the cap open, cool, and record mass m2. Continue until the difference between two successive weighings is ≤ 5 mg. Calculate wetting agent dosage as:
Wetting agent dosage = (m0 − m2)/m0
Proton-density images were acquired using a multi-slice spin-echo (MSE) sequence. LF-MRI parameters: 3 slices; slice thickness 1.8 mm; inter-slice gap 2.0 mm; number of averages 8; repetition time 260 ms; field of view (FOV) 100 mm × 100 mm; frequency-encoding steps 256; phase-encoding steps 192.
Following mechanical sieving (dual-sieve) per Chinese Pharmacopoeia 2020, Vol. IV, General Rule 0982 [12]. Take 15 g of granules from Section 2.1, dry at 50 ℃, and record mass M0. Sieve on a standard sieve shaker for 5 min (amplitude 3 mm; frequency 1400 r/min). Collect granules between the No. 1 and No. 5 sieves and record mass M1. Calculate yield as:
Granule yield = M1/M0
Inverse fitting of Q-CPMG decay curves was performed with the system’s software to obtain relaxation data (peak areas, relaxation times). T2 spectra were plotted with Origin 2018. LF-MRI images were processed with pseudo-colouring and inverse-colour rendering. Wetting agent dosage was calculated using Excel® worksheets (Microsoft, USA).
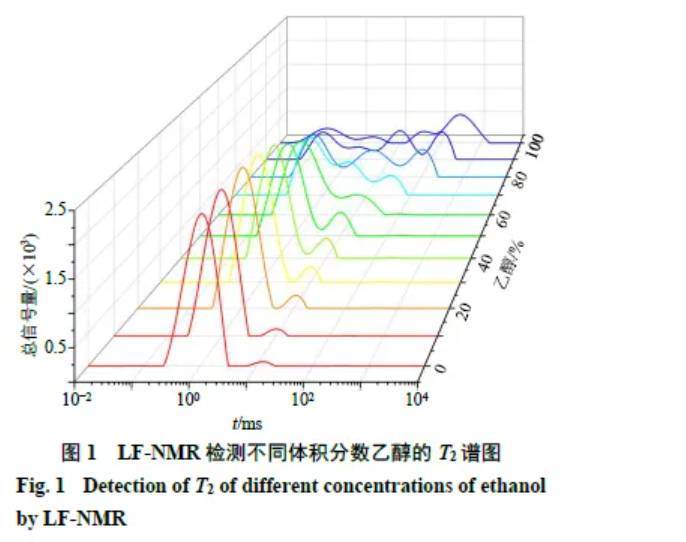
3.1.1 Detection of ethanol at different volume fractions in granules Place 100 g of a well-mixed powder blend into the granulator and add 18 g ethanol solutions of varying volume fractions for granulation. Use LF-NMR to track changes. As shown in Figure 1, three proton populations appear in the T2 spectrum: T21 (0.01–1.00 ms, bound-state protons), T22 (1.00–10.00 ms, constrained/semibound protons), and T23 (10.00–1000.00 ms, free-state protons). Peak areas (A21, A22, A23) indicate relative contents; constrained and free protons jointly constitute non-bound protons. At low ethanol fractions, only two peaks are detected; with increasing ethanol fraction, A21 decreases while A22 increases. At higher fractions, additional peaks emerge, likely because stronger ethanol content weakens powder–wetting-agent binding.
3.1.2 Linearity Linearity was assessed by the relationship between wetting agent dosage (X) measured on wet granules from Section 2.1 and the LF-NMR total T2 peak area (Y). For 5%–35% dosage, the regression was Y = 2238.3 X − 87.16 with R2 = 0.9575.
3.1.3 Repeatability Following Section 2.2.1, five parallel preparations were measured. The RSD of LF-NMR results was 2.97%, indicating good repeatability.
3.1.4 Intra-day stability One sample was tested at 11:00, 12:00, 13:00, 14:00, and 15:00 on the same day per Section 2.2.1 (storage per Section 2.1). The RSD was 2.68%, indicating good intra-day stability.
3.1.5 Inter-day stability The same sample was tested at 24, 48, 72, 96, and 120 h per Section 2.2.1 (storage per Section 2.1). The RSD was 1.02%, indicating good inter-day stability.
3.1.6 Precision One sample was measured consecutively five times per Section 2.2.1. The RSD was 3.25%, indicating good instrument precision.
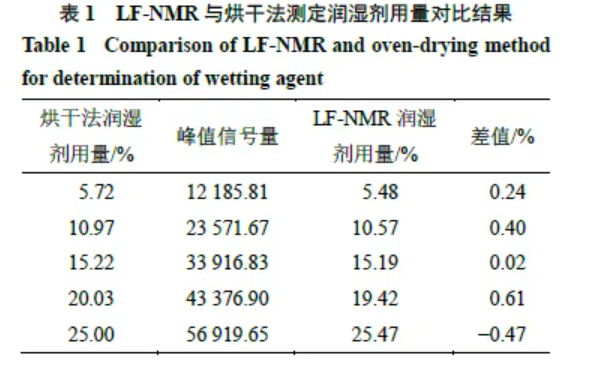
3.1.7 Accuracy Wetting agent dosages for five test samples were measured by LF-NMR (Section 2.2.1) and compared with LOD results. See Table 1. Differences between methods were < 1%, supporting good accuracy of the LF-NMR method.
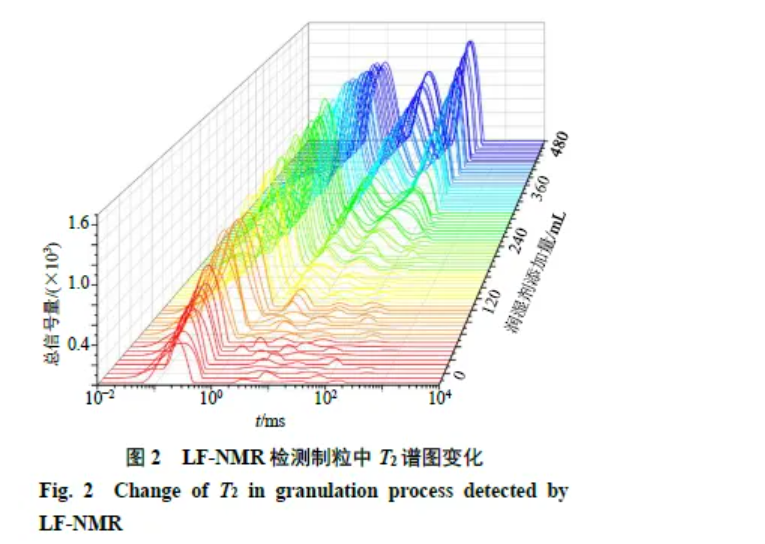
Pre-tests showed that 75% ethanol gave the highest granule yield, so it was selected as the wetting agent. In wet granules, protons exist as bound, constrained, and free states (Figure 2). Binding strength to granules differs across states: bound > constrained > free. T2 reflects these interactions. Early in granulation, most protons are bound. As granulation proceeds, peak areas increase and T2 shifts rightwards, indicating progressively looser interactions (greater mobility) among all three proton populations.
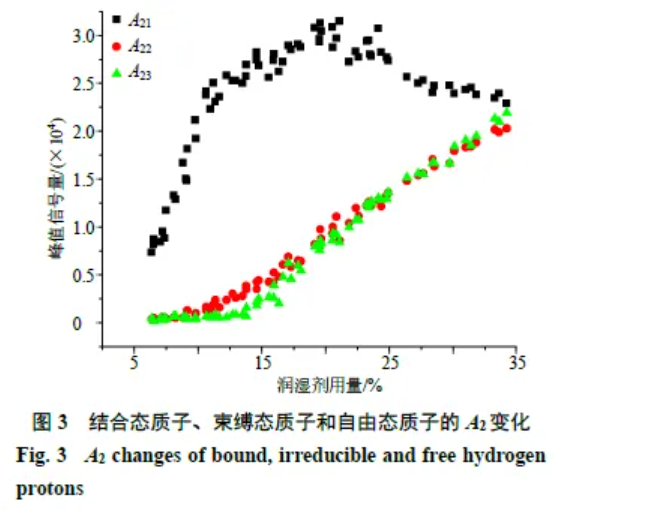
As shown in Figure 3, with increasing wetting agent, bound-state protons increase. A22 starts to rise at ~10% wetting agent, while A23 increases from ~15%, suggesting increasing moisture and surface penetration. At 20%–25%, bound-state protons level off. Beyond 25%, A21 declines, likely due to conversion of bound to non-bound states as binding weakens or saturation is reached. When a “slurry” forms (~34% wetting agent), the three populations approach steady values.
LF-MRI visualises internal moisture: proton density reflects water content. In pseudo-colour maps, red/yellow/green denote high to low proton density (red highest, green lowest). Early in granulation, wetting agent is low; non-bound wetting agent is minimal and barely detectable by LF-MRI. Mid-process, at ~20% wetting agent, imaging becomes feasible and colours intensify. At the slurry state (~34%), red areas appear (Figure 4-A).
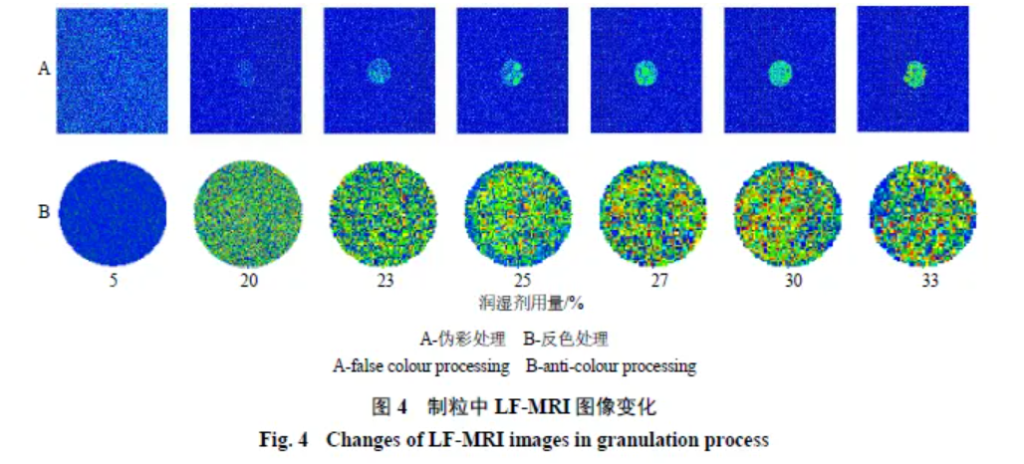
After inverse-colour processing, red appears at ~20% wetting agent but green predominates, indicating low non-bound wetting agent. Late in granulation, red and yellow dominate (Figure 4-B), indicating an excess of wetting agent. Thus, LF-MRI can intuitively characterise changes inside granules and assess distribution uniformity via proton-density variation.
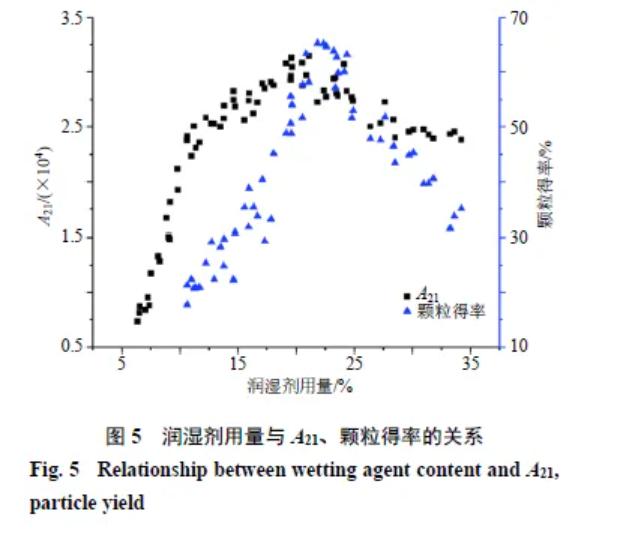
Granules agglomerate markedly when moisture falls within a certain range; below it, cohesion is weak, while above it, over-granulation occurs [13]. As shown in Figure 5, at low wetting agent levels, granule yield is low—likely related to the high specific surface area of fines [14]. Early additions bind tightly with powder as bound-state protons; hence, more wetting agent is needed initially to wet particle surfaces [6] and form nuclei before coalescence or layering. At 20%–25%, yield peaks; thereafter it declines (A21 vs yield, P < 0.05). This may reflect saturation of bound-state protons at ~25%, with conversion to non-bound states. As non-bound protons increase at particle surfaces, cohesion rises, favouring agglomeration and coating into large lumps and, with continued increase, a slurry.
Li Yan et al. [15] used LF-NMR to study ethanol–water relationships in wine, showing a linear relationship between the proportion of the T22 peak area and alcohol volume fraction. Liu Min et al. [16] examined correlations among relaxation times and hydrogen bonding in water–ethanol mixtures by LF-NMR. These reports indicate LF-NMR is suitable for ethanol detection. Existing studies in TCM preparations mainly apply LF-NMR to drying, with little on granulation; the present work is a new attempt. Given the viscosity of TCM extracts, ethanol is commonly used as binder. Based on LF-NMR principles, we applied the technique to monitor ethanol dosage and distribution during TCM granulation. Our validation shows LF-NMR can provide both qualitative and quantitative evaluation of 75% ethanol during VCYT granulation. Using LF-NMR and LF-MRI, we tracked dosage changes and spatial distributions: A21, A22, and A23 all increased and T2 shifted rightward with more wetting agent, indicating weaker constraints or greater freedom and improved mobility [17–18]. The behaviour resembles water states during rehydration [19] and aligns with Ito et al. [20] who observed T2 shifts during granulation. Proton-binding states thus offer guidance for end-point determination. Wetting agent dosage strongly affects particle size and distribution [21]: at 5%, 10%, and 15%, fines remain high; at 20%–25%, granule growth is evident and target yield peaks; beyond 25%, A21 declines, suggesting conversion from bound to non-bound, and target yield drops—consistent with Cavinato [22] and Miwa [23]. Therefore, A21 trends are informative for yield characterisation. LF-NMR/LF-MRI provide a rapid, non-destructive, visual method to monitor binder/wetting-agent changes during granulation. T2 profiles describe the amounts and states of the three proton populations; by tracking bound-state changes, one can determine optimal yield more rationally than experience-based end-points. Limitations remain: broader applicability across TCM products needs study. With advances in smart manufacturing, Chen Fangyu et al. [24] demonstrated online LF-NMR for chocolate melting, highlighting strong online capability. Given LF-NMR’s proton sensitivity, a portable online device could be developed for in-process monitoring and end-point control in granulation.
Conflict of Interest All authors declare no conflicts of interest.
Source: Zhou Guanrui, Gao Meilian, Zhang Xinrui, Yang Zhaoyang, Zhang Yao, Zhang Ailing, Luo Xiaojian, Rao Xiaoyong. Study on the evaluation of wetting agents during VCYT granulation based on LF-NMR/MRI [J]. Chinese Traditional and Herbal Drugs, 2021, 52(5): 1284–1290.
This article is a reprint of “Evaluation of Wetting Agents in VCYT Granulation Based on LF-NMR/MRI,” originally published by Journal of Chinese Materia Medica. If this reproduction infringes your rights, please contact us for removal.
 Scan QR Code
 Scan QR Code
Phone: 400-060-3233
After-sales: 400-060-3233


Back to Top