
This article presents frontier applications of Low-Field Nuclear Magnetic Resonance (NMR) technology in the fields of geotechnical engineering, energy, and geological resources. It focuses on the integration of NMR with studies on thermal damage in rocks and grayscale NMR image characterisation.
Rock thermal fracturing and damage mechanisms are gaining increased attention in nuclear waste geological disposal projects, as they represent a critical factor in understanding the full integrity of such systems. Using NMR imaging technology, pixel values in NMR images are statistically analysed to observe distribution patterns. This reveals internal structural frameworks of granite at different temperatures and helps uncover the damage mechanisms induced by thermal stress on mineral grains.
Sample Preparation
The core samples were collected from the Beishan region of Gansu Province, with an average elevation of 1600–1700 meters, annual rainfall of 78.9 mm, and annual evaporation close to 3130.9 mm—characteristic of an arid desert-gobi climate. Granite blocks with good macroscopic homogeneity were selected and machined into standard specimens of φ50 mm × 100 mm.
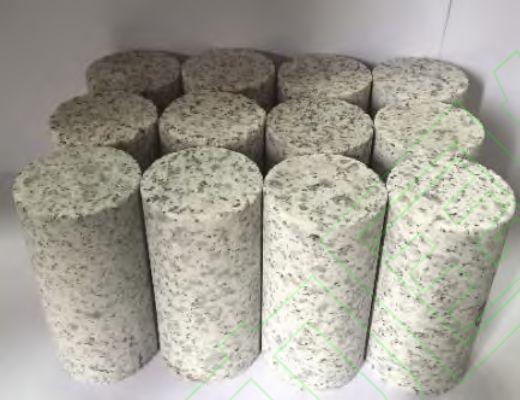
Figure 1 Granite core samples
XRD analysis showed that the samples consisted mainly of 60.59% feldspar, 34.09% quartz, and 5.32% biotite.
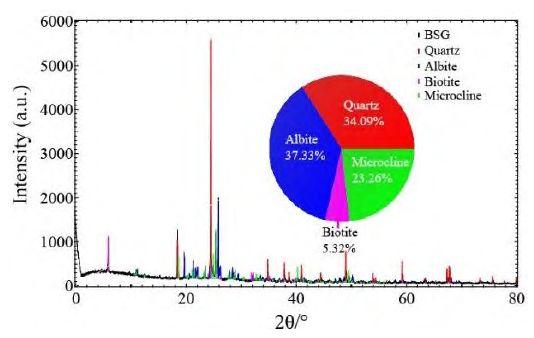
Figure 2 XRD analysis of granite
Testing Process & Microstructural Analysis
The samples were heated at a rate of 4°C/min to the target temperatures (100°C, 200°C, 300°C, 400°C, 500°C, 600°C, and 700°C), held for 2 hours, then cooled at a constant rate. Each group contained 5 specimens to minimize experimental error.
NMR tests were performed using the MacroMR12-150H-I wide-bore low-field NMR imaging analyser developed by Niumag Analytical Technologies to evaluate the thermally damaged rock cores.
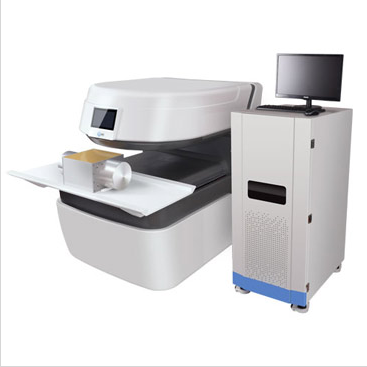
Figure 3 MacroMR12-150H-I Low-Field NMR Imaging Analyser
T2 Relaxation Analysis of Granite
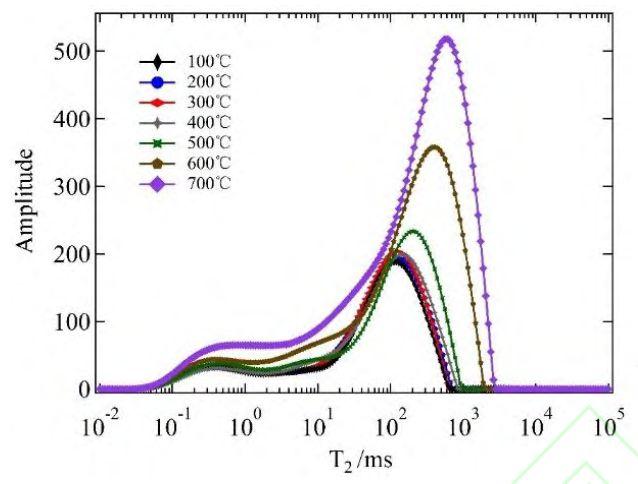
Figure 4 T2 relaxation times of granite samples at different temperatures
The T2 spectra at different temperatures show a bimodal distribution. The first peak appears below 10 ms, while the second peak (with larger amplitude) corresponds to pores with relaxation times above 10 ms, indicating that most pores fall within this range. Below 400°C, the curves are nearly identical, suggesting minimal structural changes at the micro level.
As temperature increases from 500°C to 700°C, the right-hand peak broadens significantly, and both peak amplitudes increase. This indicates that continued thermal damage leads to the formation and growth of microcracks and transgranular fractures within the rock, increasing both crack length and number. Smaller cracks gradually evolve into larger ones as temperature rises.
T2 Peak Area vs. Temperature for Granite
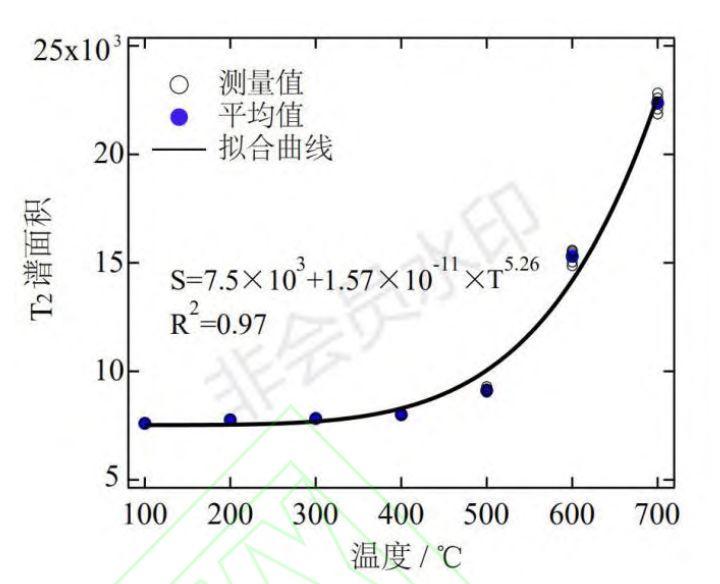
Figure 5 Relationship between T2 peak area and temperature
T2 peak area is used to evaluate thermal damage levels in rock. As shown above, when the temperature is below 400°C, the peak area remains relatively stable. However, above 500°C, there is a sharp increase in T2 peak area, displaying a power-law relationship with temperature.
NMR-Determined Porosity of Granite
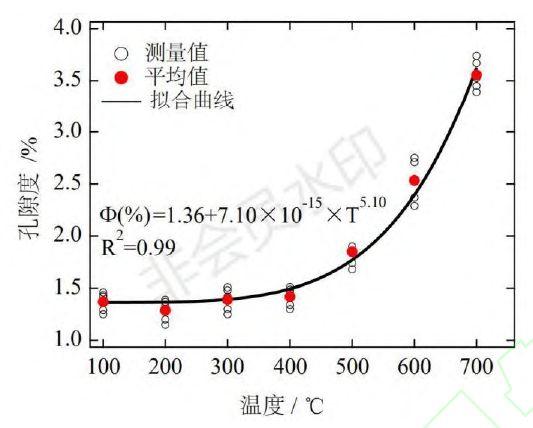
Figure 6 Relationship between Porosity and Temperature
As shown above, the variation in NMR-determined porosity with temperature closely aligns with the trend observed in the T₂ spectral area. When the temperature exceeds 500°C, internal structural changes become significant, and both metrics increase following a power-law relationship.
NMR Imaging Analysis of Granite
Darker pixel colors indicate more fluid saturation within pores and fractures, meaning higher porosity and crack development. Larger pixel values correspond to more extensive internal connectivity and void space, offering a clear visual representation of pore and fracture distribution.
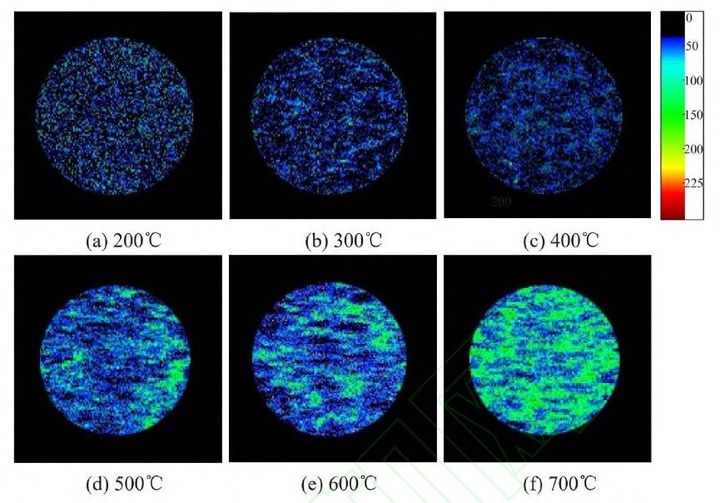
Figure 7 Proton Density Weighted Images of Horizontally Sliced Samples at Different Temperatures
The images above display horizontal proton density-weighted sections at different thermal conditions. The color bar on the right indicates the relative intensity of hydrogen protons within internal pores. Below 500°C, the proton density is relatively uniform, with no significant clustering. As the temperature rises, high-density regions merge into large interconnected zones, and microcracks evolve into extensive crack networks.
Gray-Level Distribution Characteristics in NMR Imaging
The grayscale intensity and pixel shading reflect the extent of internal damage. NMR images are composed of pixels with varying gray values. Through statistical analysis of pixel distributions, internal structure changes under thermal stress can be effectively characterised. This serves as a powerful tool for evaluating thermally induced microstructural evolution.
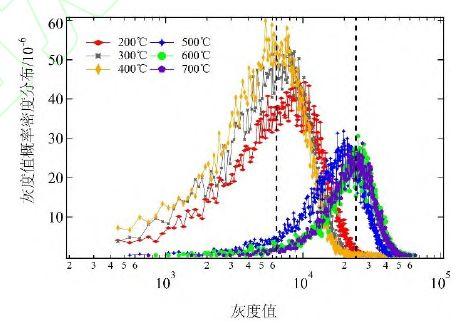
Figure 8 Probability Density Function (PDF) of NMRI Pixel Values for Different Granite Samples
The graph above presents the PDF distribution of NMRI pixel values across granite samples at different temperatures. All distributions follow a log-normal trend. As the temperature increases, the curve shifts significantly to the right, with higher pixel values indicating greater internal damage. The probability peak moves rightward, in line with the T₂ spectrum trend, offering a quantifiable means to assess thermal damage in granite.
(1) The NMR T₂ spectra show little variation below 400°C. When the temperature exceeds 500°C, the T₂ amplitude increases significantly and shifts rightward. Both T₂ area and porosity exhibit a power-law relationship with temperature rise.
(2) NMR imaging shows a uniform proton density below 500°C, with no visible clustering—indicating a stable internal structure. At higher temperatures, crystal boundary and intergranular cracks begin to form, gradually connecting into larger conductive zones.
(3) The probability density functions (PDFs) of NMRI pixel values for granite at various temperatures all follow a log-normal distribution. Beyond 500°C, the entire curve shifts to the right, suggesting a clear increase in internal damage.
Learning for Application
At present, the combined use of Low-Field NMR and X-ray CT enables quantitative evaluation of fracture evolution in porous media. In essence, this represents a form of Digital Rock Physics.
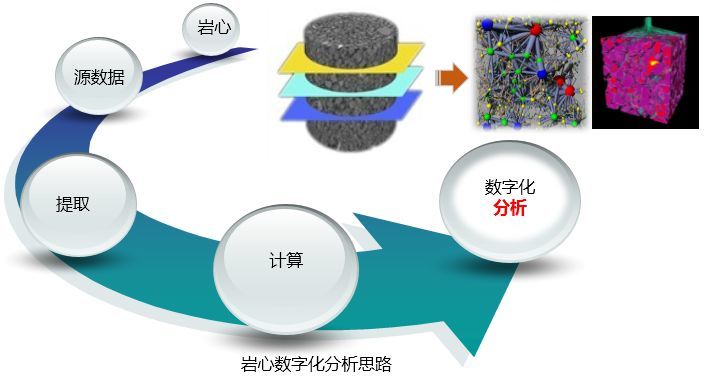
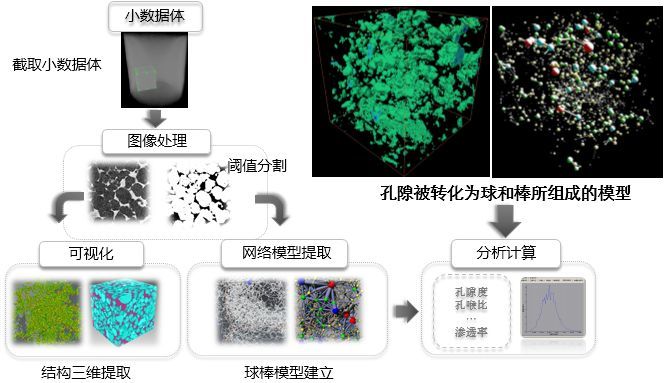
Digital rock analysis allows calculation of rock physical parameters and simulation of seepage behavior. It digitally reconstructs pore structures via nano- and micro-scale imaging, enabling quantitative characterisation of pore development and degradation. This technology is highly valuable for applications in geotechnical engineering, energy resources, petroleum extraction, and reservoir evaluation.
[1] Sun Zhongguang, Jiang Deyi, Xie Kainan, et al. Study on Thermal Damage of Beishan Granite Based on Low-Field NMR [J]. Journal of China Coal Society: 1–11.
 Scan QR Code
 Scan QR Code
Phone: 400-060-3233
After-sales: 400-060-3233


Back to Top