
Water is a major component of many foods. Each type of food contains a specific moisture level that is distributed in defined positions and bound states within the structure. Moisture content greatly influences a product’s structure, appearance, and susceptibility to spoilage.
Currently, one of the most widely used methods for studying food moisture is proton-based Nuclear Magnetic Resonance (NMR). As early as the 1950s, NMR was applied in the U.S. to investigate hydration in food matrices. Today, both domestic and international research uses NMR to study moisture states, distribution, and migration, which in turn reflects changes in internal components such as proteins—serving as an indicator of overall food quality.
• Monitoring moisture migration and quality during aquatic product storage
• Determining lean and fat content in live aquatic products (e.g., fish)
Case Study 1: NMR T2 Relaxation Profile Changes in Shrimp Stored at 4°C
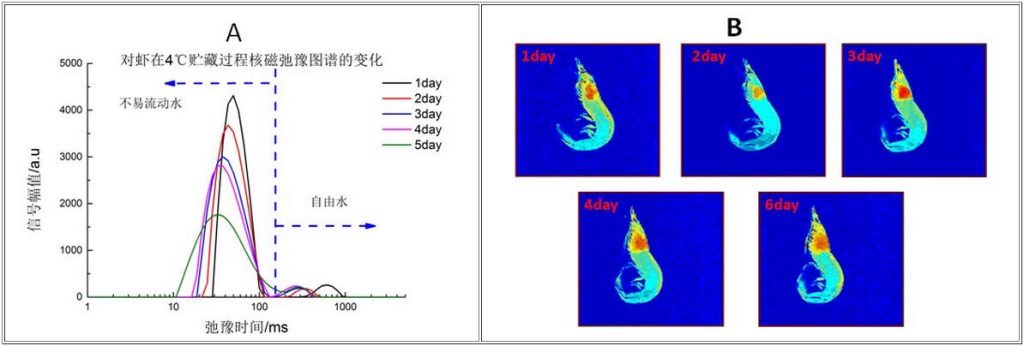
(A) Changes in T2 relaxation profiles during 4°C storage; (B) Proton density mapping over time
1. According to literature [1], immobile water is located between muscle fibers—trapped within the protein network. Free water exists outside fiber bundles. During storage at 4°C, immobile water decreases while free water first decreases, then increases. This trend is explained by surface water evaporation during early storage (especially near the gills and body surface), followed by structural degradation in mid-to-late storage. As the water-holding matrix breaks down and cellular permeability changes, tissue fluids leak out, converting immobile water into free water. This results in reduced water retention and muscle fiber relaxation—consistent with protein degradation.
2. From Image B, brightness correlates with hydrogen proton content and water mobility. During days 1–5 of storage, shrimp brightness first darkens then brightens, indicating water content first drops and later rises. Water becomes more mobile and accessible to microbial activity. In general, spoilage begins at the head region due to accelerated microbial metabolism, as reflected by increased brightness in the images.
Case Study 2: Cod Quality Monitoring During −10°C Storage
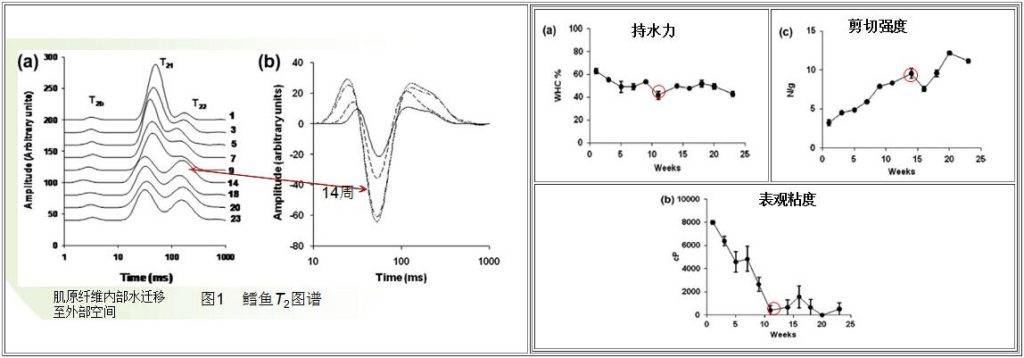
1. During −10°C storage, water within cod muscle fibers gradually migrates outward. Internal and interstitial water transitions into external regions, decreasing immobile water while increasing free water. By weeks 10–14, free water peaks while water-holding capacity and apparent viscosity reach their lowest points. Shear force increases significantly during this phase.
2. Correlation analysis shows strong exponential relationships between apparent viscosity, shear force, and water states (immobile vs. free water) throughout storage. Results confirm that LF-NMR is effective for monitoring cod quality changes during cold storage—and holds promise for shelf-life prediction of aquatic products.
Case Study 3: Moisture Distribution and Migration During Shrimp Drying
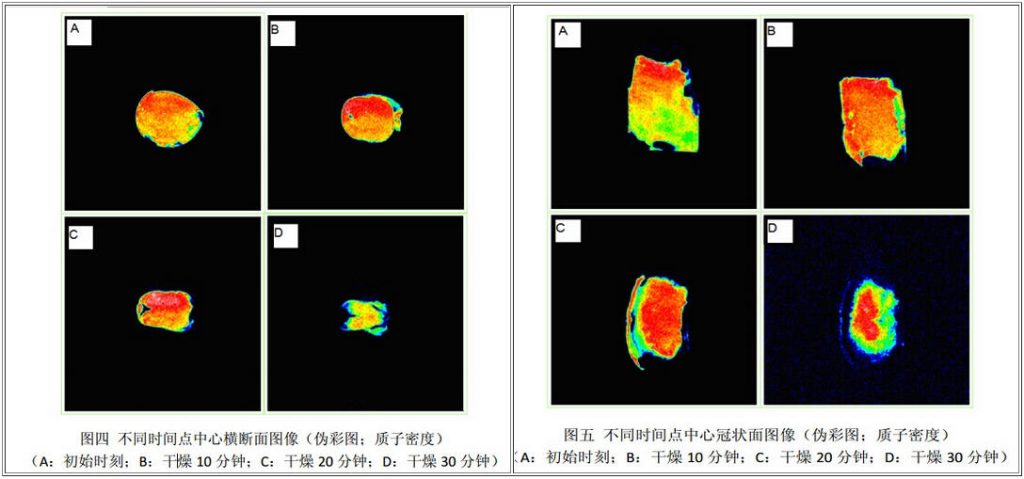
1. In MRI scans (Figures 4 and 5), color intensity indicates signal strength. Red areas represent high hydrogen proton density (more moisture), while blue areas represent lower proton density (less moisture). MRI provides a clear view of moisture changes at different drying stages.
2. Shrimp volume visibly shrinks during drying, and water distribution becomes uneven across different regions. By analyzing regional MRI signal changes, researchers can assess localized drying rates—providing a fast, intuitive tool for optimizing drying protocols and ensuring final product quality.
 Scan QR Code
 Scan QR Code
Phone: 400-060-3233
After-sales: 400-060-3233


Back to Top