
Fluid flow characteristics in tight reservoirs differ significantly from conventional reservoirs and are closely related to the microscopic pore structure. A precise understanding of reservoir pore architecture is crucial for estimating recoverable reserves and formulating effective development strategies. Low-field NMR T2 spectral distributions are directly linked to pore structure and can provide a representative view of the sample’s pore size distribution. Below is a brief introduction to the application of NMR pore-throat distribution curves.
Pore Structure Analysis:
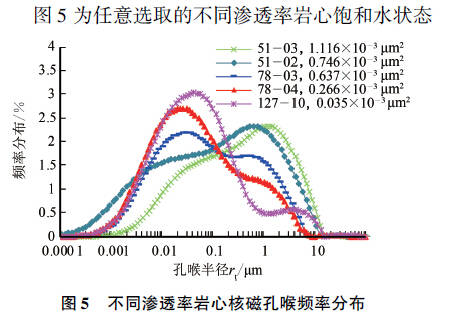
The figure below illustrates the pore-throat radius distribution derived from NMR T2 spectra for randomly selected core samples with varying permeability, under water-saturated conditions. Based on pore-throat sizes, the converted NMR pore distribution reveals a wider range of pore-throat sizes, with a noticeable increase in data points. This highlights the unique advantage of T2 spectra in characterising micro- and complex pore structures. Comparing the NMR pore-throat distributions of five cores with different permeabilities, we observe that the pore-throats are concentrated within the 0.01–1 μm range, displaying a bimodal pattern. As permeability decreases, the right-hand peak diminishes while the left-hand peak rises, indicating a decrease in large pore-throats and an increase in smaller ones.
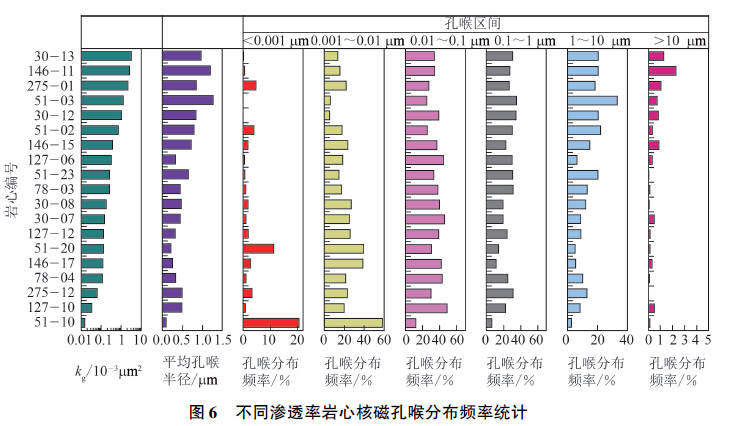
The figure below shows the frequency statistics of NMR pore-throat distributions for cores with varying permeability.
Movable Fluid Distribution:
In reservoir rocks, fluids exist in porous media as either bound or movable fluids. Due to the fine pores and high specific surface area in tight reservoir rocks, bound fluid content is significant and greatly influences fluid flow behaviour. Assessing the distribution of bound and movable fluids is therefore essential for effective development of tight oil and gas reservoirs.
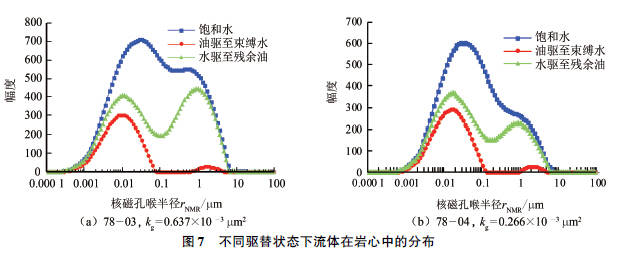
The figure below illustrates the distribution of water phases within core pores under different displacement conditions. The curve representing bound water indicates the water that remains immobile after oil displacement. The regions between the curves of saturated water and bound water, bound water and residual oil, as well as saturated water and residual oil, represent the distribution of movable fluid, movable oil, and residual oil within the pores, respectively.
Reference: “Method and Application of NMR in Studying Pore Structure of Tight Sandstones,” Journal of China University of Petroleum (Edition of Natural Science), 2015, Vol. 39, No. 6
 Scan QR Code
 Scan QR Code
Phone: 400-060-3233
After-sales: 400-060-3233


Back to Top