Core analysis is an essential approach for understanding the geological characteristics of hydrocarbon reservoirs. As a porous medium, rock exhibits complex pore structures, molecular motion within pores, reaction processes, and interrelationships between these phenomena—all of which are key subjects in core analysis. In recent years, low-field NMR core analysis has become a rapid and effective method for measuring rock physical properties. Suitable for both laboratory studies and on-site field applications, it has garnered widespread attention across the petroleum industry and continues to expand its range of applications.
1. Porosity Measurement
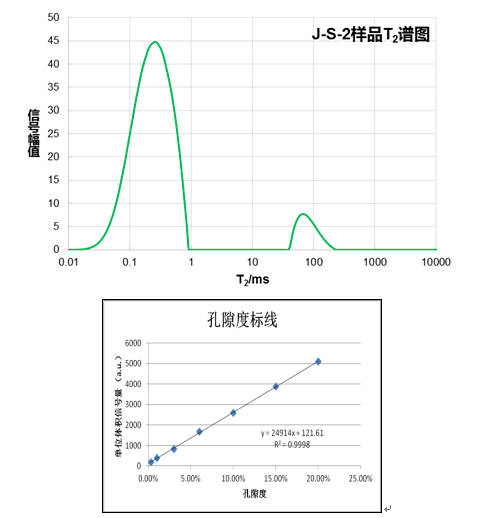
When the rock’s pores are fully saturated with fluid, the fluid volume equals the pore volume. In NMR, the integral of the relaxation time spectrum represents the fluid content within the core. By applying appropriate scaling to the T2 spectrum, the NMR-determined porosity of the rock can be obtained.
2. Determination of Oil Saturation
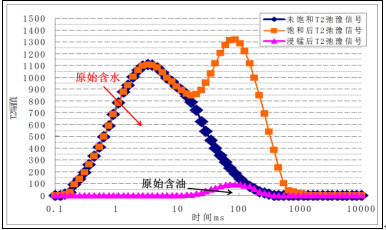
In the initial state, the T2 relaxation spectrum of the reservoir core sample corresponds to its original oil and water saturation, as indicated by the peak areas. Immersing the core in a manganese-ion solution suppresses the water signal. Testing the T2 spectrum under these conditions yields the original oil saturation, while subtracting this from the total oil + water saturation provides the original water saturation.
3. Wettability Evaluation
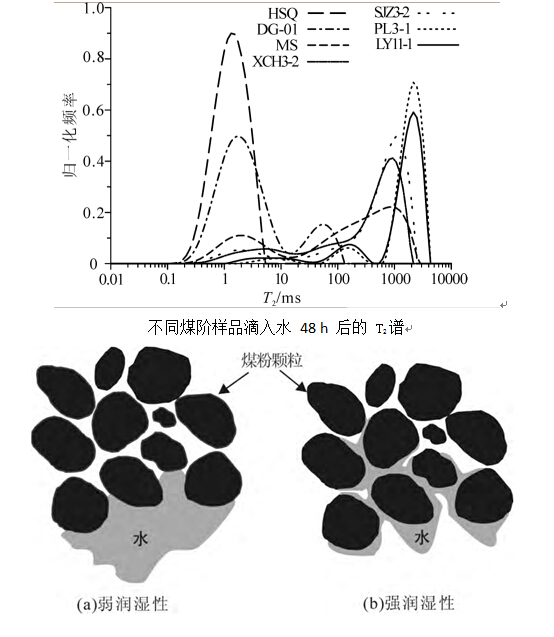
When water droplets are added to strongly water-wet coal powder, the T2 spectrum shows only adsorbed water peaks and interparticle water peaks. In weakly water-wet coal powder, free water, interparticle water, and adsorbed water peaks are present. Higher water-wettability enhances water diffusion between coal particles, increasing the interparticle water film area, shortening relaxation times of the interparticle and free water peaks, and shifting the T2 spectrum leftward over time.
4. Freeze-Thaw Damage in Rocks
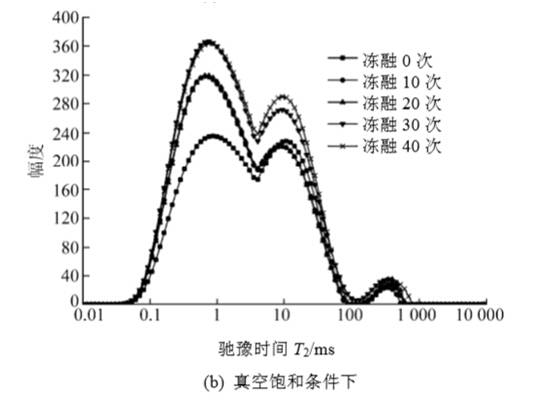
After 40 freeze-thaw cycles, the T2 spectrum of granite primarily shows three peaks. As the number of cycles increases, the spectrum shifts leftwards, towards shorter relaxation times associated with smaller pores. This indicates the formation of new micropores within the rock due to ice expansion and contraction.
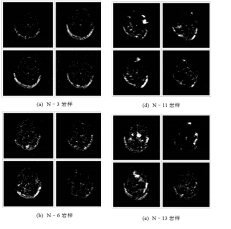
In the images, brighter areas indicate regions with higher water content, while surrounding dark regions are the background. Increasing brightness with more freeze-thaw cycles reflects expanding porosity and larger pore volume.
5. Triaxial Compression and Mechanical Damage Study
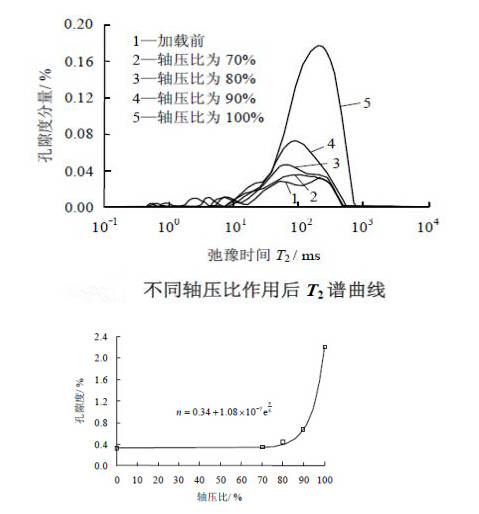
As axial stress increases, porosity generally follows an exponential growth trend. Between 0–70% of axial stress, the slope is small, indicating slow crack development and minimal damage. Between 70–90%, the slope increases significantly, reflecting rapid growth in porosity, more cracks, and widening fissures; the rock transitions from elastic to plastic deformation. From 90–100%, the slope steepens sharply, porosity multiplies, and internal pores rapidly expand and connect, leading to severe damage and eventual failure.
6. High-Temperature, High-Pressure Core Flooding Experiment
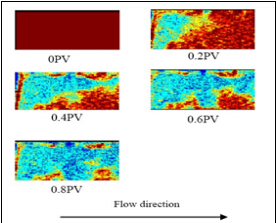
Red represents oil, and green represents water. 0 PV indicates fully saturated oil. During water flooding, the central section is displaced first, while some oil remains at the ends. Imaging clearly reveals dominant flow channels and end-face effects.
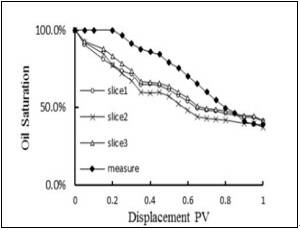
Overall, the NMR signal gradually weakens during displacement. The second core layer shows a faster decay rate than the third and fourth layers, consistent with the imaging results. NMR testing allows direct evaluation of internal displacement processes, while combining it with NMR imaging provides real-time insight into fluid changes within the core.
4. Freeze-Thaw Damage in Rocks
After 40 freeze-thaw cycles, the T2 spectrum of granite primarily shows three peaks. As the number of cycles increases, the spectrum shifts leftwards, towards shorter relaxation times associated with smaller pores. This indicates the formation of new micropores within the rock due to ice expansion and contraction.
In the images, brighter areas indicate regions with higher water content, while surrounding dark regions are the background. Increasing brightness with more freeze-thaw cycles reflects expanding porosity and larger pore volume.
5. Triaxial Compression and Mechanical Damage Study
As axial stress increases, porosity generally follows an exponential growth trend. Between 0–70% of axial stress, the slope is small, indicating slow crack development and minimal damage. Between 70–90%, the slope increases significantly, reflecting rapid growth in porosity, more cracks, and widening fissures; the rock transitions from elastic to plastic deformation. From 90–100%, the slope steepens sharply, porosity multiplies, and internal pores rapidly expand and connect, leading to severe damage and eventual failure.
6. High-Temperature, High-Pressure Core Flooding Experiment
Red represents oil, and green represents water. 0 PV indicates fully saturated oil. During water flooding, the central section is displaced first, while some oil remains at the ends. Imaging clearly reveals dominant flow channels and end-face effects.
Overall, the NMR signal gradually weakens during displacement. The second core layer shows a faster decay rate than the third and fourth layers, consistent with the imaging results. NMR testing allows direct evaluation of internal displacement processes, while combining it with NMR imaging provides real-time insight into fluid changes within the core.
 Scan QR Code
 Scan QR Code
Phone: 400-060-3233
After-sales: 400-060-3233


Back to Top