
Xinjiang’s conglomerate reservoirs in China are rich in hydrocarbon resources. However, these reservoirs are characterised by strong heterogeneity, complex pore-throat structures, and wide pore-size distributions. A quantitative analysis of full-scale pore structures and movable oil distribution is therefore critical.
Nuclear magnetic resonance (NMR) is a rapid, non-destructive method for pore characterisation. By analysing the NMR T2 spectra of cores saturated with hydrogen-bearing fluids, information on rock properties and fluid occupancy can be obtained, including porosity, permeability, pore-size distribution, and movable fluid fraction. A key step in characterising full-scale pore-size distribution is determining the conversion coefficient C between transverse relaxation time T2 and pore radius r.
Methods to obtain the conversion coefficient C include empirical methods, T2 cutoff methods, and similarity methods. The empirical method is only suitable for specific, relatively homogeneous reservoirs; the T2 cutoff method applies to reservoirs with well-connected pores; the similarity method is commonly used for low-permeability, tight reservoirs, typically combining T2 spectra with high-pressure mercury injection (HPMI) pore-size curves. However, due to the relatively low permeability of conglomerates and mercury saturation often below 50%, combining NMR with HPMI to determine C is not suitable for these reservoirs.
This study proposes a method combining low-temperature nitrogen adsorption (LTNA) with NMR to determine the C value. LTNA characterises pore-throat distribution, with the minimum identifiable pore size depending on the set minimum relative pressure. The minimum pore detectable by NMR depends on the size of the saturating fluid’s atoms and the NMR parameter TE. By selecting an appropriate saturating fluid and parameters, the pore-size distribution from LTNA and the NMR T2 spectrum show excellent agreement within the <200 nm range.
1. Experimental Overview:
18 sets of samples from Xinjiang conglomerate reservoirs were prepared (Table 1). Each set was divided into six portions for X-ray diffraction (XRD), cast thin section analysis, scanning electron microscopy (SEM), low-temperature nitrogen adsorption (LTNA), high-pressure mercury injection (HPMI), and NMR testing. NMR measurements were conducted using a MesoMR3-060H-I NMR instrument from Newma Instruments.
Table 1 Lithology and Main Mineral Content of Conglomerate Samples
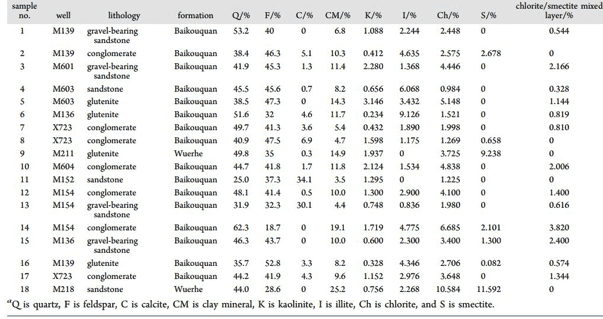
Mineral composition and depositional characteristics: Conglomerates are dominated by quartz (44.3%) and feldspar (40.1%), followed by clay minerals (10.3%), as shown in Table 1. Cast thin section analysis reveals clastic particles are primarily rock fragments (58.2%), followed by feldspar fragments (15.9%) and quartz fragments (12.3%). Sorting ranges from moderate to poor, and grains are predominantly sub-rounded to sub-angular. Higher content of quartz and feldspar fragments correlates with well-developed micron-scale pores, while more volcanic fragments, clay matrix, and cement lead to less developed micron-scale porosity.
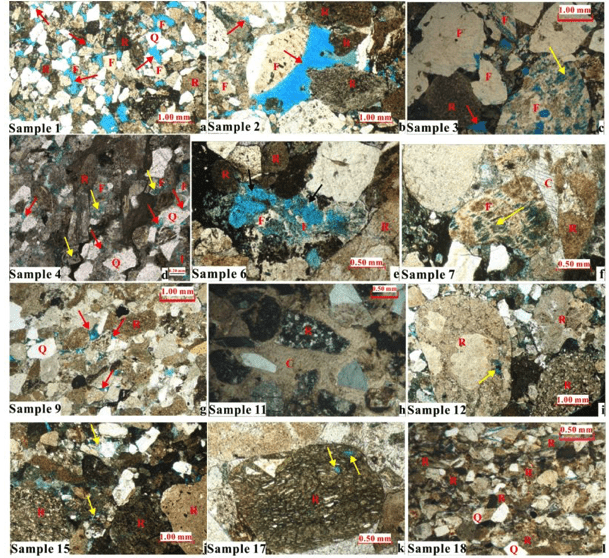
Figure 1 Main Pore Types in Cast Thin Sections (Q: Quartz; F: Feldspar; R: Rock Fragment; C: Carbonate Cement)
Reservoir space characteristics: Combined cast thin section and SEM analysis (Figure 2) reveal five types of storage space in conglomerates: primary intergranular pores, intergranular dissolution pores, mouldic pores, intragranular dissolution pores, and intercrystalline pores.
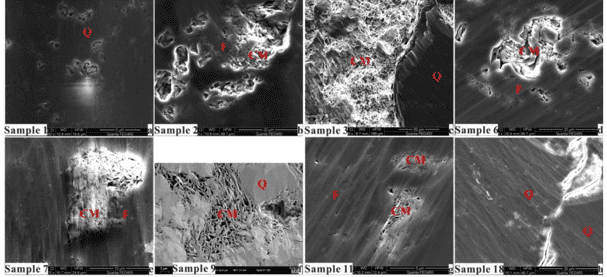
Figure 2 Major Pore Types Observed via SEM
Primary intergranular, intergranular dissolution, and mouldic pores are relatively large (tens to hundreds of nanometres); intragranular dissolution pores vary from tens of nanometres to tens of micrometres; intercrystalline clay pores are smaller, mainly from a few to tens of nanometres.
Low-temperature nitrogen adsorption: Conglomerate N2 adsorption/desorption isotherms show significant hysteresis loops, which reflect the pore morphology of the porous media. The hysteresis loops of the samples are broadly divided into four types (Figure 3): samples #1, #8, #5, and #11 correspond to open fractures, slit pores, ink-bottle pores, and narrow-neck wide-body ink-bottle pores, respectively.
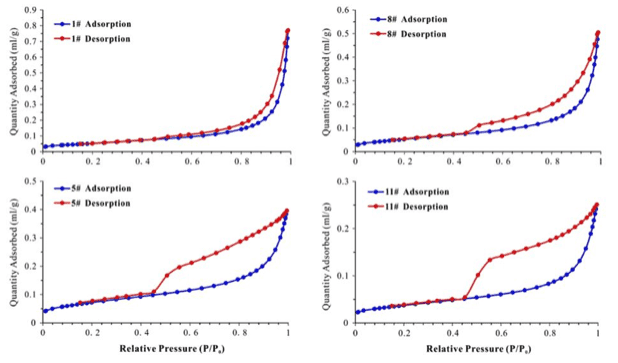
Figure 3 Nitrogen Adsorption/Desorption Isotherms of Conglomerate Samples
Pore-size distribution obtained via the DFT model is shown in Figure 4. Curves are either left-skewed or unimodal, mainly distributed above 0.02 μm.

Figure 4 Pore-Size Distribution of Conglomerate Samples via DFT Model
NMR T2 spectra: Samples were measured under three conditions: (1) washed with solvent and dried at 110°C; (2) saturated with n-dodecane (So); (3) centrifuged n-dodecane-saturated (Soir). The T2 spectra of washed and dried samples represent bound water on particle surfaces and tightly bound hydroxyl water in clay layers. T2 spectra in So and Soir states are corrected by subtracting the dried sample spectrum.
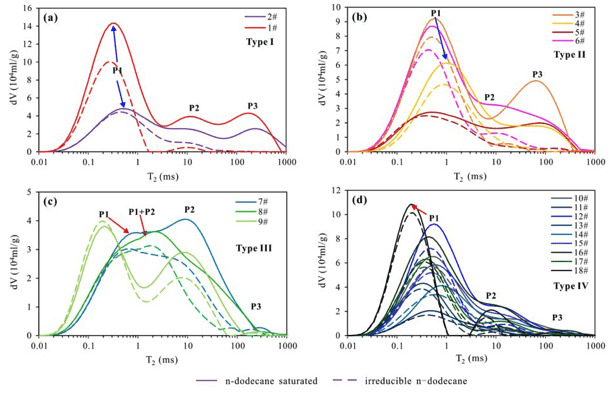
NMR T2 Spectra under So and Soir States
The NMR T2 spectra in the So state (solid line, Figure 5) show a trimodal distribution with four identified types: Type I has three continuous peaks, with P1 highest, P2 and P3 similar; Type II shows prominent P1 and P3 peaks, with P3 shifted left; Type III shows P1 and P2 or P1+P2 peaks; Type IV has a dominant P1 peak with smaller P2 and P3 peaks.
The Soir state was obtained by centrifuging the saturated samples to remove movable oil. Calculations indicate residual oil resides in pores smaller than 0.014 μm or in pores controlled by throats under 0.014 μm. Soir T2 spectra (dashed line, Figure 5) generally show two peaks (P1 and P2).
T2 cutoff values were determined from So and Soir spectra (Figure 6). Values for 18 samples ranged from 0.438 to 12.993 ms, significantly lower than conventional sandstones and carbonates. Variations in T2 cutoff are mainly influenced by lithology, wettability, ferromagnetic content, and pore-throat structure.
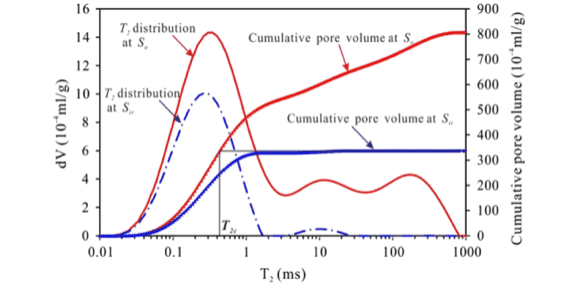
T2 Cutoff Values Calculated from So and Soir Spectra
Comparison of So and Soir spectra allows quantitative evaluation of movable oil saturation (Smo). Smo decreases from Type I to IV samples (47.49–25.01%).
New Method to Convert T2 Spectra into Pore-Size Distribution
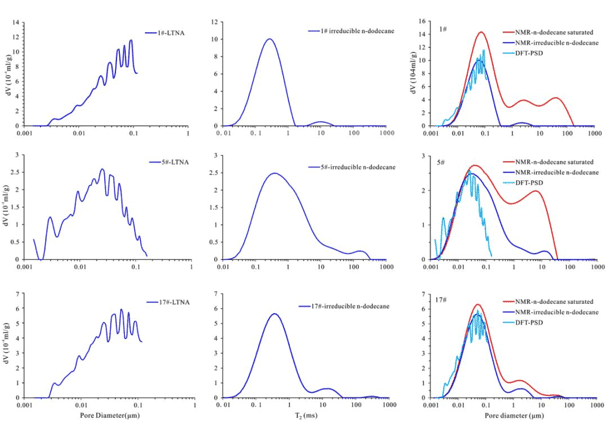
Figure 7 Comparison of DFT-Derived Pore-Size Distribution with Soir NMR T2 Spectrum
By comparing Soir T2 spectra with DFT pore-size distribution curves, the first peak in the Soir spectrum closely matches the DFT curve in both shape and amplitude (Figure 7). Therefore, DFT-derived distributions can calibrate NMR T2 spectra. The formula for calculating the conversion coefficient C is shown below:

Where rgm is the weighted geometric mean from the DFT model, RLTNA is the pore volume fraction from low-temperature nitrogen adsorption corresponding to Voir, Voir is NMR pore volume in Soir state, Aoir is cumulative NMR signal in Soir, and T2gm(RLTNA) is the T2-weighted geometric mean for that fraction in Soir.
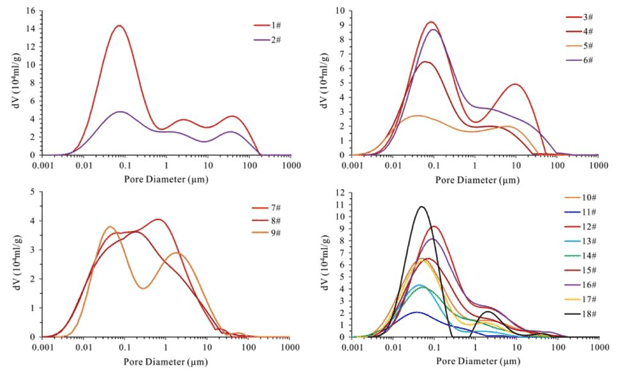
Figure 8 Full-Scale Pore-Size Distribution of Conglomerate Samples
Full-scale pore-size distributions derived using C are shown in Figure 8. Type I samples develop pores mainly between 0.001–200 μm; Type II are mostly below 100 μm; Type III primarily below 20 μm; Type IV samples feature mostly nanoscale pores with few microscale pores.
Analysis of Movable Oil Distribution and Controlling Factors
Across all samples, pores larger than 6 μm—mainly intergranular, intergranular dissolution, and mouldic pores—contain the majority of movable oil (>90%). Pores 0.1–6 μm—mainly intragranular dissolution and clay interlayer pores—show increasing movable oil fraction with pore size (20–80%). Pores below 0.1 μm—mainly clay interlayer—mostly contain residual oil (<20%). Larger pore fractions correspond to higher movable oil saturation.
Analysis of movable oil volume versus mercury intrusion volume shows movable oil mainly resides in pores with throats >0.44 μm. At the micro level, movable oil distribution is controlled by pore-throat structure. Figure 9 summarises the five major pore-throat types and their movable oil fractions: A > C > B > D > E.
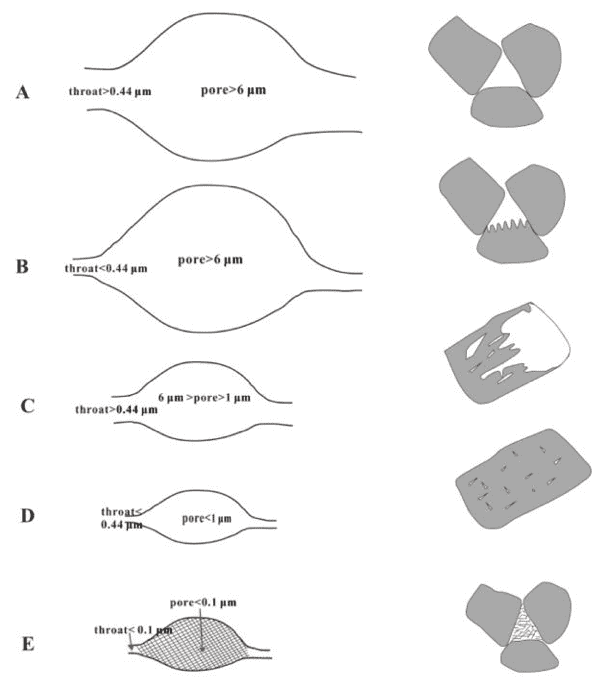
Figure 9 Five Major Pore-Throat Structures in Conglomerates
Macroscopically, mineral composition and rock structure influence pore-throat characteristics, thereby controlling oil mobility. Higher quartz content enlarges throats and initial pores, promoting Type A pores; higher feldspar content promotes Types A, B, and C; higher calcite content reduces pore-throat sizes, enhancing Type D; more clay minerals favour Types D and E. Movable oil saturation increases with quartz and feldspar content and decreases with calcite and clay content.
This study quantitatively characterised full-scale pore-size distributions, movable oil distribution, and controlling factors for 18 conglomerate samples, with the following key outcomes:
 Scan QR Code
 Scan QR Code
Phone: 400-060-3233
After-sales: 400-060-3233


Back to Top