
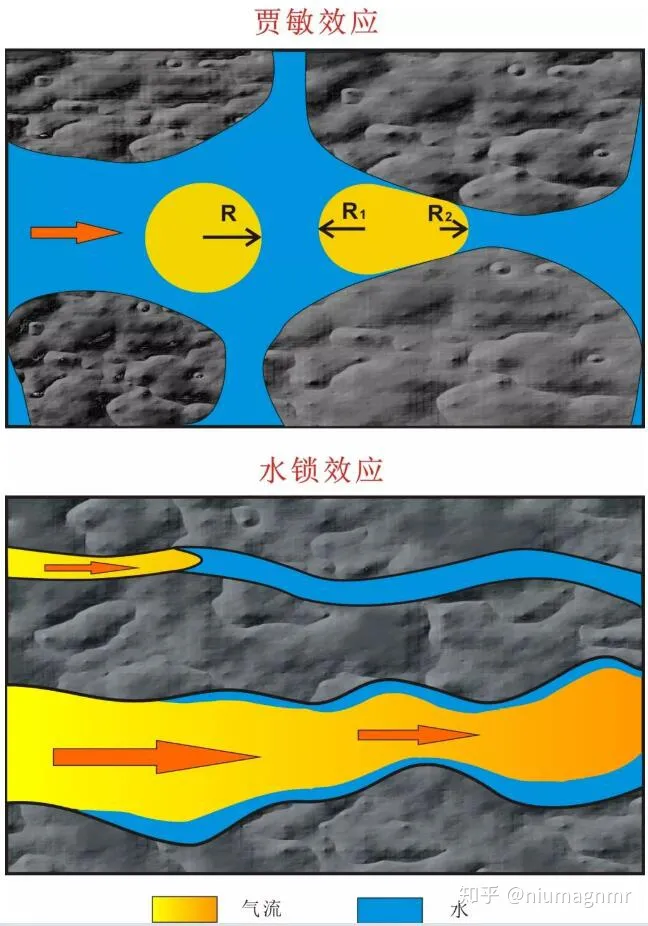
The water-blocking effect arises during oil and gas development when drilling fluids or completion fluids invade the reservoir, causing a reduction in oil and gas phase permeability near the wellbore. Development of unconventional tight reservoirs heavily relies on hydraulic fracturing, yet field experience shows that the flowback rate of fracturing fluids is often very low. Large amounts of retained fracturing fluid lead to water-blocking and Jamin effects (see Figure 1), causing reservoir damage, which significantly hampers unconventional oil and gas recovery.
From current domestic and international studies, research on the water-blocking effect in the petroleum sector is relatively mature, focusing on mechanisms, causes, and mitigation methods. There are mainly two approaches to relieve water-blocking: ① modifying fracturing fluid properties by altering surface tension; ② altering rock pore characteristics.
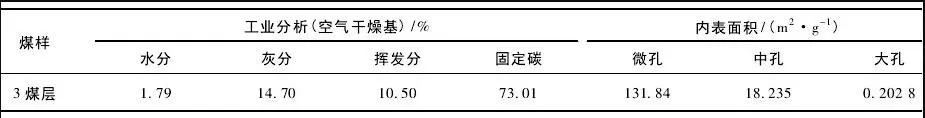
The experimental coal samples were taken from the No. 3 coal seam of the Changping Mine, Jinmei Group. Sample details are listed in the table below.
The study used NMR (benchtop nuclear magnetic resonance) to investigate methods to relieve water-blocking in coal reservoirs. The procedure was as follows:
1. Twenty cylindrical coal samples (25 mm diameter × 50 mm height) were prepared from Changping Mine coal.
2. Twelve samples were vacuum-saturated for 480 minutes dry and 240 minutes wet, ensuring complete water saturation. Each saturated sample underwent NMR testing to derive T2 distributions.
3. The twelve NMR-tested, saturated samples were centrifuged at speeds ranging from 1,000 to 12,000 r/min for 30 minutes. A second NMR test was conducted to obtain T2 distributions. Core analysis software calculated T2 cutoff values, BVI, and FFI parameters to study the effect of pore negative pressure on relieving water-blocking. Pore negative pressure, expressed as the ratio of centrifugal force to internal surface area, can be calculated using mercury intrusion and CO2 adsorption tests. The coal sample had a surface area of 130 m²/g, enabling calculation of pore negative pressure.
Figure 2 shows the T2 distributions of the twelve original coal samples, and Figure 3 shows the T2 distributions after centrifugation at different speeds. Water-blocking parameters calculated by NMR core analysis software at various centrifuge speeds are listed in Table 2.
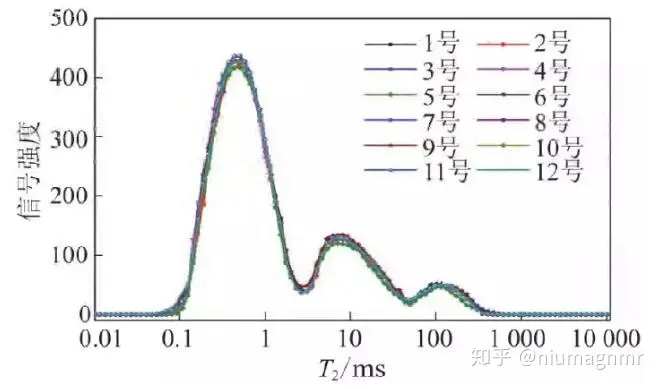
Figure 2. T2 Distribution of Saturated Coal Samples
Figure 2 indicates that all twelve original coal samples share similar internal pore size distributions. After centrifugation at increasing speeds (Figure 3), the first relaxation peak gradually decreases but remains stable as speed increases from 1,000 to 7,000 r/min; the second and third peaks remain unchanged. At 10,000 r/min, all three peaks decrease significantly. At 12,000 r/min, the first peak stabilises while the second and third peaks nearly disappear.
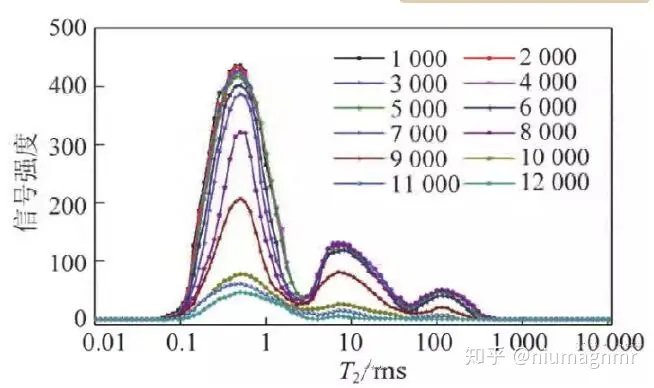
Figure 3. T2 Distribution at Different Centrifuge Speeds
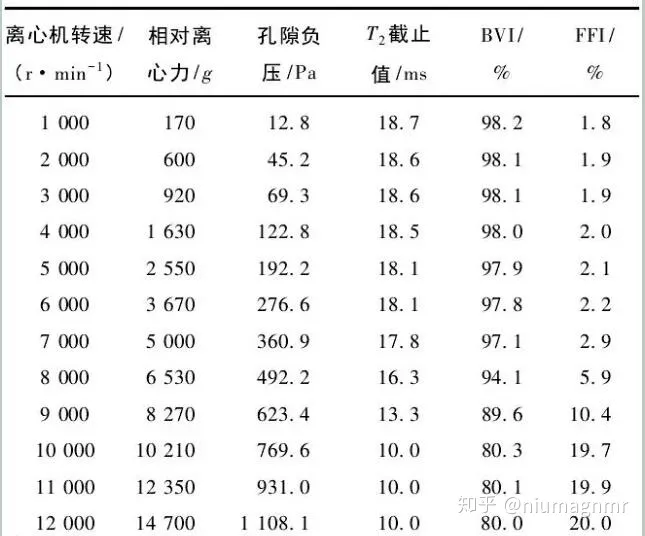
Table 2 shows that as centrifuge speed increased from 1,000 to 12,000 r/min, pore negative pressure rose from 12.8 Pa to 1,108.1 Pa. T2 cutoff values and BVI decreased with speed, while FFI increased. Trends of T2 cutoff, BVI, and FFI are shown in Figures 4 and 5, dividing the process into three stages.
Table 2. Parameter Changes at Different Centrifuge Speeds
 Scan QR Code
 Scan QR Code
Phone: 400-060-3233
After-sales: 400-060-3233


Back to Top